$TIA Breakout Brewing! After months of steady accumulation and LSE:TIA Breakout Brewing!
After months of steady accumulation and holding strong support, #TIA is showing signs of a major trend reversal. Double-digit targets look highly likely in the coming months if momentum continues. 🚀
Hit likes 🚨🚨
.
..
.
.
.
.
#Bitcoin #altcoin #btc #memecoin CRYPTOCAP:BTC NYSE:FET GETTEX:WOO CRYPTOCAP:INJ GETTEX:QNT $tsuka $azero NEWCONNECT:MLT EURONEXT:RNDR LSE:ROSE BIST:LINK CRYPTOCAP:XRP CRYPTOCAP:PEPE #iran #qatar #usa #IsraelIran
TIAUSD trade ideas

TIAUSD Long Setup – Wedge Breakout Alert!Chart Timeframe: 30-Minute
Trade Type: Long (Buy)
Pattern: Falling wedge breakout ✅
Entry Point: Around $2.207 (breakout candle)
Stop Loss: Around $2.160 (below wedge support)
Target 1: $2.341 (first resistance)
Reward: ~6%
Risk: ~15.8%

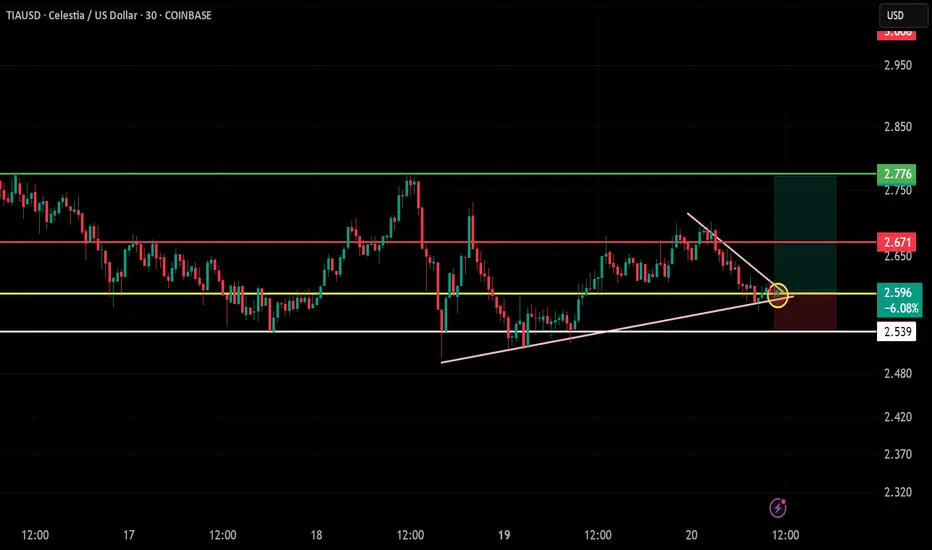
Trade Setup Summary – TIAUSD (Celestia / USD)!
📈
Chart: 30m timeframe
🔺 Pattern: Breakout from Downtrend Line + Ascending Triangle Support
Current price action suggests a breakout above minor descending resistance while maintaining higher lows – bullish structure.
📍 Entry Zone: Around $2.597
Breakout confirmation near triangle apex and horizontal support (yellow zone).
🛑 Stop-Loss (SL): $2.539
Below trendline support and recent swing low.
🎯 Target Levels (TP):
TP1: $2.671 (Red resistance level)
TP2: $2.776 (Green resistance zone)
TP3 (optional): $3.008–$3.10 (Major liquidity zone)
⚖️ Risk/Reward Ratio:
Excellent R:R – Close to 1:2.5+ depending on exit level.
🧠 Technical Highlights:
Volume shows a little rise post-breakout (check live for confirmation).
Downtrend line now broken.
Price respecting ascending triangle support and yellow zone (prior resistance → support flip).
✅ Bias:
Bullish above $2.59
Bearish below $2.54 (false breakout or breakdown)
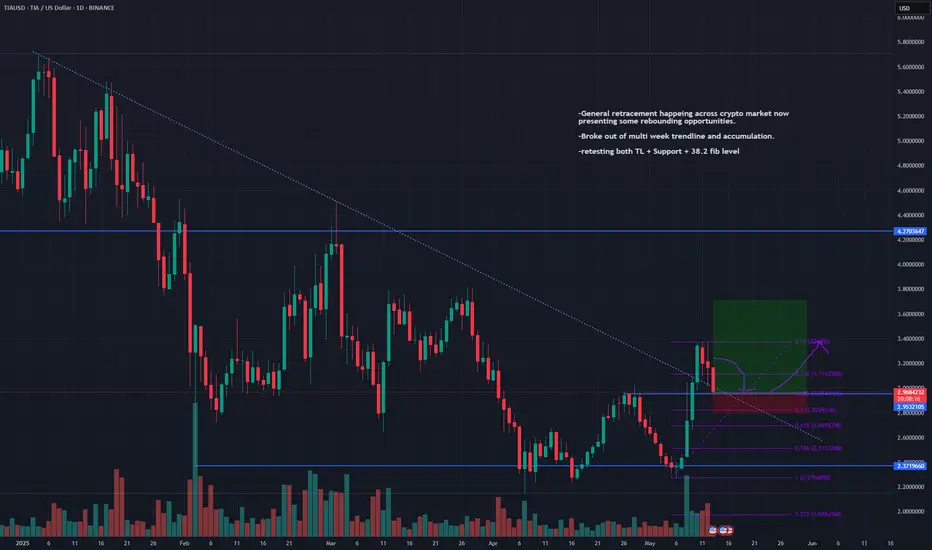
TIAUSDT - LONG-General retracement happeing across crypto market now presenting some rebounding opportunities.
-Broke out of multi week trendline and accumulation.
-retesting both TL + Support + 38.2 fib level
TIA ready for breakout?!Look at this chart. It seems TIA is ready to break the descending line of resistance..

TIAUSD just broke above the 5-month Falling Wedge!Celestia (TIAUSD) made a major bullish break-out today as not only did it break above its 1D MA50 (blue trend-line) but also above the 5-month Lower Highs trend-line (December 06 2024), which is the top of the Falling Wedge pattern!
With the 1D RSI also on Higher Lows, this bullish momentum is targeting the 2.0 Fibonacci extension level at 4.000, which is where contact with the 1D MA200 (orange trend-line) is expected to be made.
-------------------------------------------------------------------------------
** Please LIKE 👍, FOLLOW ✅, SHARE 🙌 and COMMENT ✍ if you enjoy this idea! Also share your ideas and charts in the comments section below! This is best way to keep it relevant, support us, keep the content here free and allow the idea to reach as many people as possible. **
-------------------------------------------------------------------------------
💸💸💸💸💸💸
👇 👇 👇 👇 👇 👇

TIA2USD - Falling Wedge on Down Trend Falling Wedge in blue along the down trend in white
Falling wedges break out bullishly
This bullish break out will be the first real bull run for this coin
Not sure how high it could go, should go beyond previous ATH though
Daily timeframe

LONG it’s gonna be a bumpy ride!Price has finally hit all time lows and consolidating nicely. Demand has been met and we’re ready to bounce! Pack your bags 🚀 🧨 🚀

GOOOOO!TIA - Looks set up for an explosive rally.
Should tell a lot after breaking through the immediate resistance zone.

Tia’s Next Move: Opportunity Below $6?Tia/USDT has been lagging recently, and while other altcoins surged strongly after Trump’s election, Tia only recently managed to break above a key resistance level at $6.
After reaching the recent high, the price corrected and is now back at the previous resistance level, which has turned into support.
I expect this support to hold, and if it does, we could see a new upward leg for Tia.
The immediate resistance is in the $7.3–$7.5 zone, and a breakout above this level could pave the way for further gains, potentially reaching the next key resistance levels at $9 or even $12.
Buying below $6 could offer a solid entry point with a favorable risk-to-reward ratio.

Celestia ($TIA) goes wild82% retrace. Accumulation. Breakout.
Send TIA back to its previous highs with haste.

TIAUSD Its 1st ever 1D Golden Cross can take it to $46.00!Celestia (TIAUSD) is ahead of its first 1D Golden Cross in history, which should have been completed by next Monday the latest. Having broken above the Lower Highs trend-line that has dominated the majority of 2024, the only technical obstacle now is the 1W MA50 (red trend-line).
If that breaks, we expect the 1D Golden Cross to deliver a parabolic rally similar to November 2023 - January 2024. That was a +1018.18% rise from the bottom, which gives us a target estimate of $46.00.
-------------------------------------------------------------------------------
** Please LIKE 👍, FOLLOW ✅, SHARE 🙌 and COMMENT ✍ if you enjoy this idea! Also share your ideas and charts in the comments section below! This is best way to keep it relevant, support us, keep the content here free and allow the idea to reach as many people as possible. **
-------------------------------------------------------------------------------
💸💸💸💸💸💸
👇 👇 👇 👇 👇 👇

Ascending Wedge for TIA/USDAscending Wedge Pattern. Wedge height = approx $1.40. Expecting a breakout of the wedge to the upside. Currently at $8.15, looking to take profits @ $9.40. This coincides nicely to top out at the 0.618 Fibonacci level.

Celestia's Climb: A Strategic Blueprint for Capitalizing on CrypThe crypto market's ever-evolving landscape has unveiled Celestia's ascent, a narrative that parallels the early market behavior of Solana. With a launching pad at approximately $2.50, Celestia is poised at a crossroads that could mirror Solana's historical price action, presenting investors with both cautionary tales and strategic opportunities.
Solana's Legacy as a Market Beacon
Solana's rise from a modest $2.50 to a peak of $14 created a precedent, a point where prudent profit-taking or hedging could have optimized returns. Its subsequent retracement to the 0.236 Fibonacci level was a tale foretold, as the market braced for the dilution from new token issuance. The savvy investor who harnessed this ebb and flow turned volatility into opportunity, re-entering the market with amplified strength post-correction.
Celestia's Current Voyage
Celestia now sails similar seas, trading at $11 with a significant token emission on the horizon. This upcoming phase could likely induce a retracement to the 0.236 Fibonacci level, previously a springboard for Solana’s price to catapult to new highs. For Celestia, reaching the $14 mark may serve as a signal for investors to secure profits or establish hedges — a prudent maneuver to safeguard against anticipated retracements.
The Strategic Interlude
As Celestia approaches the $14 threshold, investors could consider this an opportune moment to solidify gains or initiate hedging strategies. The liquidity or profits secured here could provide the ammunition to re-enter the market with a more substantial position when Celestia touches down at its 0.236 Fibonacci support level. This strategy leverages the market's cyclical nature and positions investors to capitalize on the potential upswing that may follow the token emission.
Forecasting Celestia's Horizon
If Celestia does indeed echo Solana's pattern, the journey from the 0.236 level could see its value soar towards a 4.235 Fibonacci level, approximating a target of $52. This pathway, while informed by historical parallels, is navigated within the unpredictable winds of market dynamics.
Conclusion:
Celestia offers a case where historical market patterns provide a strategic map for navigation. With foresight and precision, $14 could be the juncture for profit-taking or hedging, leading to a re-engagement at the 0.236 Fibonacci level for a potent re-entry. The past may offer a guiding light, but it is the investor's acumen that will steer the course through the mercurial waves of cryptocurrency markets.
Disclaimer:
This predictive analysis is based on historical patterns and market parallels. It does not constitute financial advice and should not be taken as such. The cryptocurrency market is inherently volatile and unpredictable, and investors should proceed with caution, armed with thorough research and professional consultation.

Complex iHSbullvidence
iHS
multi-month consolidation
kumo breakout + kumo twist
entry: here or slightly higher
exit $10ish
SL: <$5

TiaTIA serves as the native token of the Celestia blockchain, a pioneering modular network that seeks to innovate and redefine blockchain technology. The TIA token has multiple applications within the Celestia ecosystem, including:
1. *Data Publication:* Rollups can utilize TIA to facilitate the payment for data publications within Celestia’s blockspace.
2. **Network Security:** Users have the opportunity to stake TIA, thereby participating in the consensus process and contributing to the network's security.
3. ***Gas Token for Developers:*** Developers can use TIA as a gas token for various transactions.
The architectural framework of Celestia effectively separates the consensus and execution layers of the blockchain, which is intended to create a more scalable and customizable environment for developers.
COINBASE:TIAUSD
BINANCE:TIABTC

TIA - don't miss this opportunityA great chart - with a break out and a nice 1-2 waves fractal of the likely larger impulsive advance.

CELESTIA (TIA/USD) GO LONG. 100% UPSIDE POTENTIAL.The price action of TIA has formed an accumulation pattern on the weekly chart.
It has a beautiful upside potential of at least 100%.
First target $12, second target $14.
No stoploss, no leverage.
Peace!

Base traps on the stairway UPWelcome to alt season!
Pick your alt and enjoy the ride!
🐻 🪤 on the stairway to Heaven!
First 🎯 : $7.30

TIA only bullish after breaking $7.70TIA has had a good few days. On lower timeframes it looks like a HS could be forming. That is if we now break decisively higher. On the longer timeframe it looks like we broke the descening line. Feels bullish now.
But we only start being bullish if TIA succeeds to break $7.70-ish. Previously this has been a bottom area. But in july the price tried to reclaim that pricepoint, without succes. It also is only the 0.236 fib level. So rejection there again, would be really bad. Only if we reclaim $7.70, and not get rejected, traders could eye $10 prices. But again, then we are only at the 0.382 fib. There is much work to be done. I am cautious, especially with future unlocks coming end October.

$TIA - Bottom Formation LSE:TIA is forming its bottom here. Reclaimed strong support after a shakeout. OBV Bullish Divergence and breakout. Base is widening.
Get ready for lift off on this one. Leads the market so move over to BTC after big moves as insurance.

TIA (The Last Dip Before 10x)Celestia
TIA is one of the best new coins imo which are TIA, SEI, ORDI, TAO.
The confirmation:
A final dip between $3.03 : $2.38 shall happen, if the price breaks $4.01.
The invalidation:
Passing $7.67 without dropping to the targeted area first.

