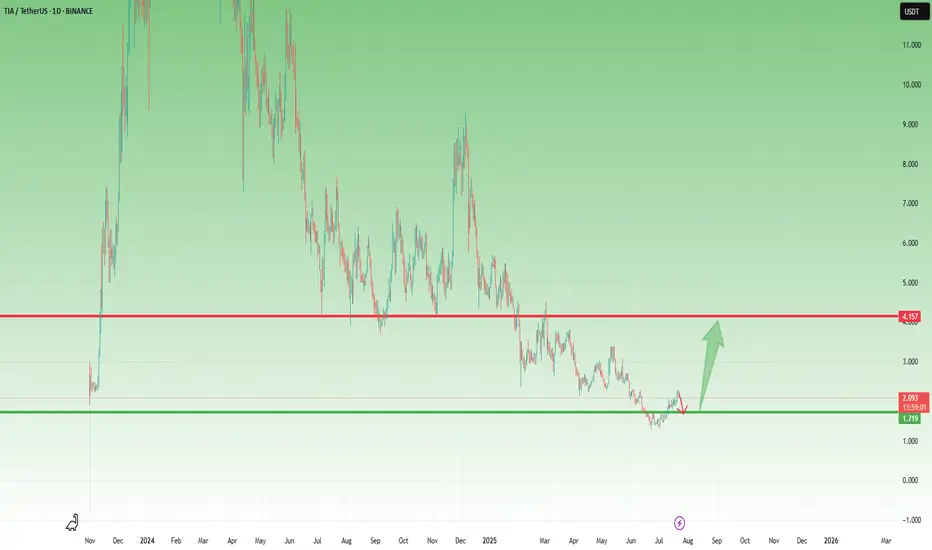
TIA/USDT – Major Breakout Incoming? Reversal in Sight!🔍 Full Technical Analysis (1D Timeframe):
TIA/USDT is approaching a critical turning point after experiencing a strong downtrend since December 2024. The chart clearly forms a Falling Wedge pattern — a classic bullish reversal signal known for explosive breakouts when confirmed.
Currently, the pri
Related pairs

TIA- Is the Coin Finally Ready to Wake Up?After its launch on Binance in November 2023 and the immediate 10x pump, BINANCE:TIAUSDT has been, to put it mildly, a constant disappointment.
Since then, the hype has faded, and the price slowly deflated — leaving holders frustrated and the chart uninspiring.
🔍 Recent Signs of Life
However
TIAUSDT 1D#TIA is on the verge of breaking out above a major resistance cluster, which includes the descending channel, the Ichimoku Cloud, and the daily SMA100. Keep an eye on it — every dip could present a solid buying opportunity.
In case of a confirmed breakout above the resistance cluster, the targets ar

$TIAComeback cooking? #crypto
Reclaim deviation on weekly, couple daily closes would make for decent setup and clear invalidation.

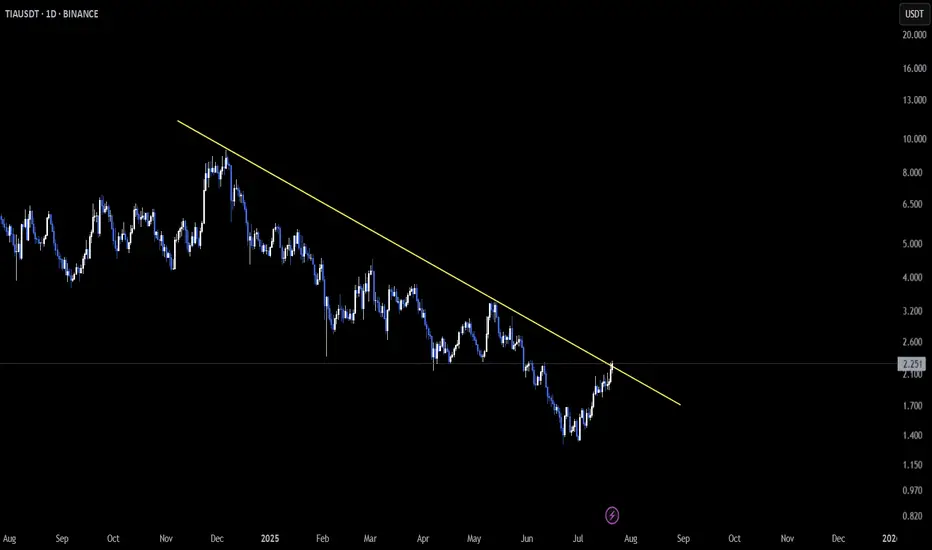
TIA – Fresh Breakout Unfolding from Daily ChannelLSE:TIA is setting the stage for a potential shift in momentum as it breaks out of the descending channel on the daily timeframe 🚀.
This kind of breakout often signals a change in direction, especially if the market confirms the move with a successful retest 🔁.
So far, price action is hinting at
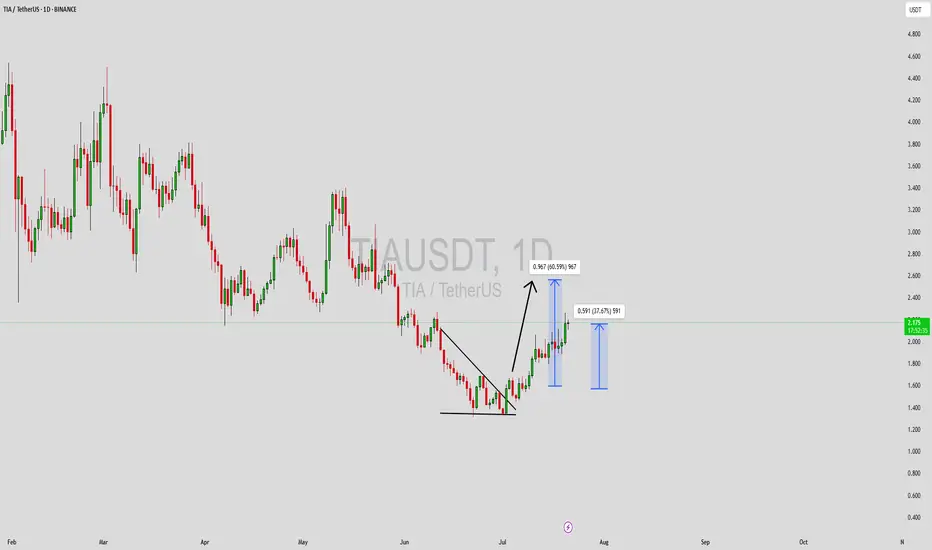
TIAUSDT Forming Falling WedgeTIAUSDT has recently shown a bullish breakout from a falling wedge structure on the daily timeframe—a pattern known for its strong reversal signals. This move is supported by rising trading volume, signaling fresh momentum entering the market. With current price action pushing higher, the short-term
TIA Double Bottomed, $4.5 PossibleBYBIT:TIAUSDT.P bottomed out at the $2.3 level. From there, its initial rally took it to the $3.4 level. If a bottom formation occurs again at its current level, another rally could push it first to the $3.8 level, and if the rally is strong, potentially up to $4.5. Strength into higher levels are

TIA Trying Catch Falling Knifeafter downtrend continuation from early December 2024, i think we will meet target around 1.2 with several factor
if we can hold this line maybe we will have small pullback for retest resistance

Free signal hello friends👋
🌟Considering that the price reaches an important weekly support, the price is expected to grow, so you can enter into a transaction with risk and capital management and move to the specified goals.
🔥Follow us for more signals🔥
*Trade safely with us*

TIAUSDT Monitoring Completion of Bearish 5-Wave FormationTIAUSDT remains in a structured downtrend, nearing completion of a potential 5-wave bearish pattern similar to a previous setup that led to an upside breakout before resuming the decline. A similar scenario is anticipated this time, with plans to go long if price action confirms a strong rejection a

See all ideas
Summarizing what the indicators are suggesting.
Oscillators
Neutral
SellBuy
Strong sellStrong buy
Strong sellSellNeutralBuyStrong buy
Oscillators
Neutral
SellBuy
Strong sellStrong buy
Strong sellSellNeutralBuyStrong buy
Summary
Neutral
SellBuy
Strong sellStrong buy
Strong sellSellNeutralBuyStrong buy
Summary
Neutral
SellBuy
Strong sellStrong buy
Strong sellSellNeutralBuyStrong buy
Summary
Neutral
SellBuy
Strong sellStrong buy
Strong sellSellNeutralBuyStrong buy
Moving Averages
Neutral
SellBuy
Strong sellStrong buy
Strong sellSellNeutralBuyStrong buy
Moving Averages
Neutral
SellBuy
Strong sellStrong buy
Strong sellSellNeutralBuyStrong buy
Displays a symbol's price movements over previous years to identify recurring trends.
Frequently Asked Questions
The current price of TIA / TetherUS (TIA) is 1.864 USDT — it has fallen −6.85% in the past 24 hours. Try placing this info into the context by checking out what coins are also gaining and losing at the moment and seeing TIA price chart.
TIA / TetherUS price has fallen by −10.17% over the last week, its month performance shows a 13.04% increase, and as for the last year, TIA / TetherUS has decreased by −70.91%. See more dynamics on TIA price chart.
Keep track of coins' changes with our Crypto Coins Heatmap.
Keep track of coins' changes with our Crypto Coins Heatmap.
TIA / TetherUS (TIA) reached its highest price on Feb 10, 2024 — it amounted to 21.142 USDT. Find more insights on the TIA price chart.
See the list of crypto gainers and choose what best fits your strategy.
See the list of crypto gainers and choose what best fits your strategy.
TIA / TetherUS (TIA) reached the lowest price of 1.310 USDT on Jun 22, 2025. View more TIA / TetherUS dynamics on the price chart.
See the list of crypto losers to find unexpected opportunities.
See the list of crypto losers to find unexpected opportunities.
The safest choice when buying TIA is to go to a well-known crypto exchange. Some of the popular names are Binance, Coinbase, Kraken. But you'll have to find a reliable broker and create an account first. You can trade TIA right from TradingView charts — just choose a broker and connect to your account.
Crypto markets are famous for their volatility, so one should study all the available stats before adding crypto assets to their portfolio. Very often it's technical analysis that comes in handy. We prepared technical ratings for TIA / TetherUS (TIA): today its technical analysis shows the sell signal, and according to the 1 week rating TIA shows the sell signal. And you'd better dig deeper and study 1 month rating too — it's sell. Find inspiration in TIA / TetherUS trading ideas and keep track of what's moving crypto markets with our crypto news feed.
TIA / TetherUS (TIA) is just as reliable as any other crypto asset — this corner of the world market is highly volatile. Today, for instance, TIA / TetherUS is estimated as 12.06% volatile. The only thing it means is that you must prepare and examine all available information before making a decision. And if you're not sure about TIA / TetherUS, you can find more inspiration in our curated watchlists.
You can discuss TIA / TetherUS (TIA) with other users in our public chats, Minds or in the comments to Ideas.