TIA Trying Catch Falling Knifeafter downtrend continuation from early December 2024, i think we will meet target around 1.2 with several factor
if we can hold this line maybe we will have small pullback for retest resistance
Related pairs

TIAUSDT – Potential Reversal in Play Price is showing early signs of a bullish reversal after a prolonged downtrend.
Currently testing the 200 EMA from below, a key decision zone.
Plan:
• Entry Zone: Above 1.550 (pending confirmation)
• SL: 1.519 (below recent demand zone)
• TP: 1.835
• RR: 1:5+
⚠️ If price reclaims the 200 EMA

$ENS / USDT Daily Time frame, MAJOR PUMP?Chart Overview
- Pattern Identified: Falling Wedge Pattern
- A bullish reversal pattern, often appearing after a downtrend.
- Three major touchpoints on the lower trendline indicate strong support and pattern validity.
Demand Zone (Support Area)
- Marked near the current price level (

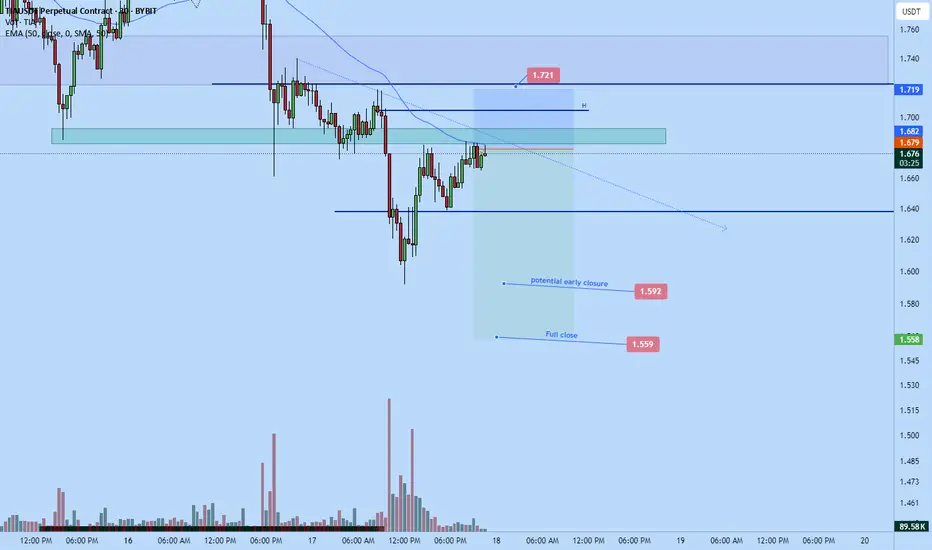
Tia short-dump continues to $1.56Just took a short position on Tia.
Target: $1.56
Stop: $1.721
roughly 3RR
Market likely to continue dumping soon
DTT applied.
OVerall market is heading down, market objective is likely to make new lower lows. Correction happening now before continuation. Market is back at supply area that sold
TIA Scalp trade setupwait for the retest of breakout, set sl & tp. While on swing trade will long below 1.31 and tp 2.0$, TIA is extremely oversold, So less affected by BTC.

TIA Dynamic Support Line for Buy PointsThe support I have set for Tia purchase
The QT process is ongoing. There is no liquidity in the market. In non-major markets, support levels are dynamically shifting downwa

TIA Dynamic Support LineThe support I have set for Tia purchase
The QT process is ongoing. There is no liquidity in the market. In non-major markets, support levels are dynamically shifting downwards.

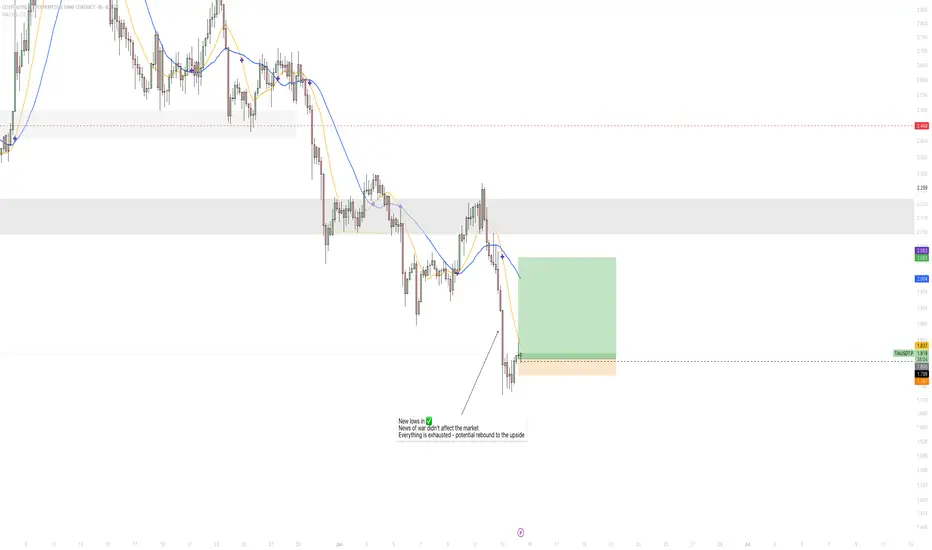
TIA/USDTLooking to execute this trade over the weekend. The dotted line is set for additional PO.
What I am keen to see is a reversal upon good news -- market seems quite exhausted so it might move easily to the upside.
TIAUSDTTIAUSDT
SPOT
BUY NOW
LONG TERM
This is a personal analysis, it can and will have good growth potential.

Tia demand.Tia retraced to major demand zone, this could be an opportunity.
Golden pocket.
Equilibrium of the structure.
NFA

See all ideas
Summarizing what the indicators are suggesting.
Oscillators
Neutral
SellBuy
Strong sellStrong buy
Strong sellSellNeutralBuyStrong buy
Oscillators
Neutral
SellBuy
Strong sellStrong buy
Strong sellSellNeutralBuyStrong buy
Summary
Neutral
SellBuy
Strong sellStrong buy
Strong sellSellNeutralBuyStrong buy
Summary
Neutral
SellBuy
Strong sellStrong buy
Strong sellSellNeutralBuyStrong buy
Summary
Neutral
SellBuy
Strong sellStrong buy
Strong sellSellNeutralBuyStrong buy
Moving Averages
Neutral
SellBuy
Strong sellStrong buy
Strong sellSellNeutralBuyStrong buy
Moving Averages
Neutral
SellBuy
Strong sellStrong buy
Strong sellSellNeutralBuyStrong buy
Frequently Asked Questions
The current price of Celestia / USDT (TIA) is 1.4540 USDT — it has risen 7.78% in the past 24 hours. Try placing this info into the context by checking out what coins are also gaining and losing at the moment and seeing TIA price chart.
Celestia / USDT price has fallen by −7.75% over the last week, its month performance shows a −34.84% decrease, and as for the last year, Celestia / USDT has decreased by −32.15%. See more dynamics on TIA price chart.
Keep track of coins' changes with our Crypto Coins Heatmap.
Keep track of coins' changes with our Crypto Coins Heatmap.
Celestia / USDT (TIA) reached its highest price on May 8, 2025 — it amounted to 3.7390 USDT. Find more insights on the TIA price chart.
See the list of crypto gainers and choose what best fits your strategy.
See the list of crypto gainers and choose what best fits your strategy.
Celestia / USDT (TIA) reached the lowest price of 1.3280 USDT on Jun 22, 2025. View more Celestia / USDT dynamics on the price chart.
See the list of crypto losers to find unexpected opportunities.
See the list of crypto losers to find unexpected opportunities.
The safest choice when buying TIA is to go to a well-known crypto exchange. Some of the popular names are Binance, Coinbase, Kraken. But you'll have to find a reliable broker and create an account first. You can trade TIA right from TradingView charts — just choose a broker and connect to your account.
Celestia / USDT (TIA) is just as reliable as any other crypto asset — this corner of the world market is highly volatile. Today, for instance, Celestia / USDT is estimated as 8.31% volatile. The only thing it means is that you must prepare and examine all available information before making a decision. And if you're not sure about Celestia / USDT, you can find more inspiration in our curated watchlists.
You can discuss Celestia / USDT (TIA) with other users in our public chats, Minds or in the comments to Ideas.