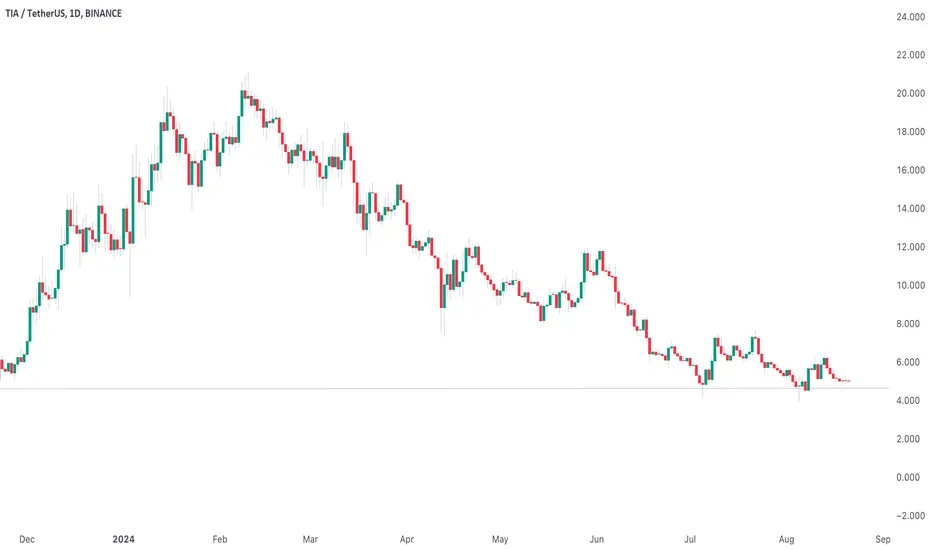
$TIA Breakout: Ready for a Bullish Rally!LSE:TIA USDT: Long Position 🚀
TIA is breaking out from a falling wedge pattern, which is a bullish reversal setup. The price has recently breached the upper trendline resistance, signalling a potential strong upward move. If the breakout holds, there is significant upside potential as marked in the chart.
Entry Point: Current Market Price (CMP) around $5.20
Additional Positions: Consider adding more if the price retests the trendline support near $4.80–$5.00.
🎯 Targets:
$6.20
$7.80
$8.50
$9.80
$12.5(Final Target)
⛔️ Stop Loss (SL): $4.60 to manage downside risk.
⚖️ Leverage: Use leverage cautiously, between 3x and 5x depending on your risk tolerance.
#Crypto
TIAUSDT trade ideas

TIA breaking descending parallel channelLSE:TIA #TIAUSDT #TIAUSD #TIA
TIA breaking descending parallel channel, with a retest and confirmation candle on daily.

Buy Trade Idea for #TIADescription
TIA (TianCoin) is showing potential as a strong candidate for a buy trade, thanks to its solid fundamentals and growing presence in the cryptocurrency market. Here are the key aspects driving this potential:
- **Innovative Blockchain Solution:** TIA operates on a highly scalable and efficient blockchain platform designed to support large-scale decentralized applications (dApps) and smart contracts, making it attractive for developers and users.
- **Strong Developer Ecosystem:** TIA is backed by an active and innovative developer community, continually driving improvements and enhancing the utility of the network, further strengthening its value proposition.
- **Low Transaction Costs and Speed:** TIA’s protocol ensures fast transaction processing and low fees, making it ideal for both everyday transactions and larger enterprise-level applications.
- **Growing Adoption:** TIA has seen a rise in adoption across various sectors, including decentralized finance (DeFi), gaming, and supply chain solutions, indicating strong market interest and potential for future growth.
With these robust fundamentals, TIA presents an appealing opportunity for those looking to buy into a cryptocurrency with solid growth potential.
Disclaimer
Trading and investing in cryptocurrencies involves significant risk and can result in substantial losses. The content provided here is for informational purposes only and should not be considered financial advice. Always conduct your own research, consider your risk tolerance, and consult with a financial advisor before making any investment decisions. Past performance is not indicative of future results, and the value of investments can fluctuate widely.

$TIA - Are we getting a bullish token unlock?TIA Celestia comes with a steep falling wedge after an 82% drawdown.
Will this VC coin recover soon?
Are we getting a bullish token unlock similar to Solana's in 2021?
We had a decent reaction from the daily with a triple-drive setup. However, price is now getting rejected again from DEMA50
If price finds acceptance above $4.80, there's a chance will hit $8.20
Otherwise, a loss of 4.20 support would be a concern, and rotation back to 2.40 is possible.

TIAUSDTLSE:TIA ~ 2D ✅
#TIA The bulls will never return before the price breaks out of this descending pattern, or if you are patient enough,. There's nothing wrong with placing your purchase in our demand zone.

CELESTIA (TIA) - Anticipating an UpsurgeConditions are favorable for taking a long position at these lows. The weekly candle should close within this price range to provide more confidence in holding a swing trade.
The price action supports the idea of going long since it has reacted to August's low and shows a change in character following the significant drop from $6.15.
I am targeting $5, but if conditions improve beyond expectations, I will aim for the previous high of $6.15.
Long LSE:TIA

THE WHALES accumulate in TIATIA is going between 70$ -90$ and now we are making a bottom
there's small chance for the eth to go down for last move down for the worst case but don't afraid just be patience
don't be greedy . don't but your all eggs in one basket
this is my analyse it's not a recomandation to buy or sell !!

TIA PriceTIA crypto continued to sail in the bearish wave and faced a massive erosion of over 60% in the last three months, conveying the bearish sentiments.

$TIA 1D chartLSE:TIA 1D chart;
#Tia, which made 8x in a very short time with its debut, taking the wind of being the first in the modular field, has been in a downtrend since February.
It almost came back to the level it left.
It started to show positive mismatch on the RSI side. It may show a movement with the market's first positive move.
The $5 level can be considered as the first short target.

Alikze »» TIA | Ready to pullback to the broken structure🔍 Technical analysis: Ready for a pullback from the liquidity zone to the broken structure
- According to the analysis of the previous post , TIA currency is moving in a downward channel.
- As can be seen, lower floors and ceilings are forming, which further reinforces the bearish view.
- Currently, in the 1D time frame, it is in the liquidity zone, which can target 3.17 with a pullback to the neckline and then the green box zone.
- Therefore, in the case of a pullback to the broken structure and selling pressure in the Fibo area of 1.618, it can touch the mentioned targets.
💎 Alternative scenario: In addition, if it can break the neck line, it will have the ability to grow up to the supply area of the previous ceiling and the ceiling of the channel.
»»»«««»»»«««»»»«««
Please support this idea with a LIKE and COMMENT if you find it useful and Click "Follow" on our profile if you'd like these trade ideas delivered straight to your email in the future.
Thanks for your continued support.
Best Regards,❤️
Alikze.
»»»«««»»»«««»»»«««
BINANCE:TIAUSDT

TIAUSDT Soars to New Heights, Hitting All Targets at 5.900!TIAUSDT has experienced a remarkable rally, reaching all set targets and surging to a price of 5.900. This bullish movement reflects strong market demand and positive sentiment among traders. The coin broke through multiple resistance levels, confirming the strength of its upward trend. Several technical indicators, including moving averages and RSI, signaled bullish momentum. The rally has attracted increased buying interest, pushing the price to new highs. Investors are now eyeing the next potential moves as TIAUSDT establishes itself at this elevated level.


TIA — Careful, This Is Not The Bottom!From a chart perspective, one can interpret that TIA has found its bottom after declining ~75%.
• The level at ~4.5 served as a solid support.
• The curve has flattened lately
• Volume increase at the bottom
However, one essential aspect is why I won't touch this token!
According to its vesting plan, the project will unlock 16.5% of its total tokens at the end of October.
In other words, circulating tokens will increase by ~35% from one day to the other.
Therefore, it is likely that we will encounter intense sell pressure before the event (people try to sell before the supply increases) and also after the event.
Please keep that in mind when trading/investing!
Tia longEarly was liquidity collection and we can see supply zone.
I see foramtion bars it perfect enter point for me.
I have a position.

TIA CelesTIA Perfect Buy Entry ?TIA from my TA perspective is looking like it just retested an older support now.
This could become a great opportunity if the market arises from this lows
Ironically 5 july and again 5 aug were critical moments for the price dips.
Unlike other newer or more volatile coins TIA had hold this support and
managed not to break the 5 july low - as many other coins dipped into the abys


Trading opportunity for TIAUSDTBased on technical factors there is a Buy position in :
📊 TIAUSDT
🔵 Buy Now or by Breakout
🪫Stop loss 4.970
🔋Target 1 5.360
🔋Target 2 5.840
🔋Target 3 6.350
💸RISK : 1%
We hope it is profitable for you ❤️
Please support our activity with your likes👍 and comments📝

TIAUSDT.P Strong Bullish Indicators Above $5.09TIAUSDT.P is currently trading at $5.090, and several technical indicators suggest a bullish trend is likely. The Relative Strength Index (RSI) is above 50, indicating increasing buying momentum. The Moving Average Convergence Divergence (MACD) line has crossed above the signal line, signaling a potential upward movement. Furthermore, TIAUSDT.P has established strong support around the $5.00 level, which has been tested and held firm. Additionally, the price is above the 50-day Moving Average, indicating a positive trend. Given these indicators, TIAUSDT.P is likely to continue its upward trajectory, making it a strong buy at the current price.

TIA's next moveYou can buy TIA at the current market price of $6 on the spot. Expecting a potential 2-3x increase in the coming weeks. Target prices are indicated on the chart.
Hold it as a mid-term investment.

Buy Zone This coin is def in the buy zone. It looks juicy in the daily and the weekly. Great opportunity to load up the bag for the next run up. Also so many other alts are on the buy zone.
Mind you the time frame is here is daily and weekly, so, good returns will be around dec 2024 or 2025.
Not a financial advice.

Short on tia Tia is going to 4.9 . So you can make a good money on this. Maybe id going to 3.8 so it is a bear market. If you have tia sell it .

TIA (Celesita): Falling Wedge BreakoutTrade setup : Price is in a Downtrend, however, it had a bullish breakout from Falling Wedge pattern and above $6.00 resistance, which could signal at least a temporary bullish trend reversal. Upside potential to $7.45. This is a riskier trade setup because it’s a trend reversal not a trend continuation setup. It’s against the overall downtrend. Learn to trade breakouts in Lesson 7 and Risk Management in Lesson 9.
Patterns : Falling Wedge Usually results in a bullish breakout. When price breaks the upper trend line the price is expected to trend higher. Emerging patterns (before a breakout occurs) can be traded by swing traders between the convergence lines; however, most traders should wait for a completed pattern with a breakout and then place a BUY order. Learn to trade chart patterns in Lesson 8.
Trend : Short-term trend is Up, Medium-term trend is Strong Down and Long-term trend is Strong Down.
Momentum : Price is neither overbought nor oversold currently, based on RSI-14 levels (RSI > 30 and RSI < 70).
Support and Resistance : Nearest Support Zone is $6.00, then $5.00. Nearest Resistance Zone is $7.45, then $10.50.

TIA holding supportTIA broke resistance and retested it, turned it back to support around 6.05
looking for support to hold at this region
then we can pump to 7.3 region
