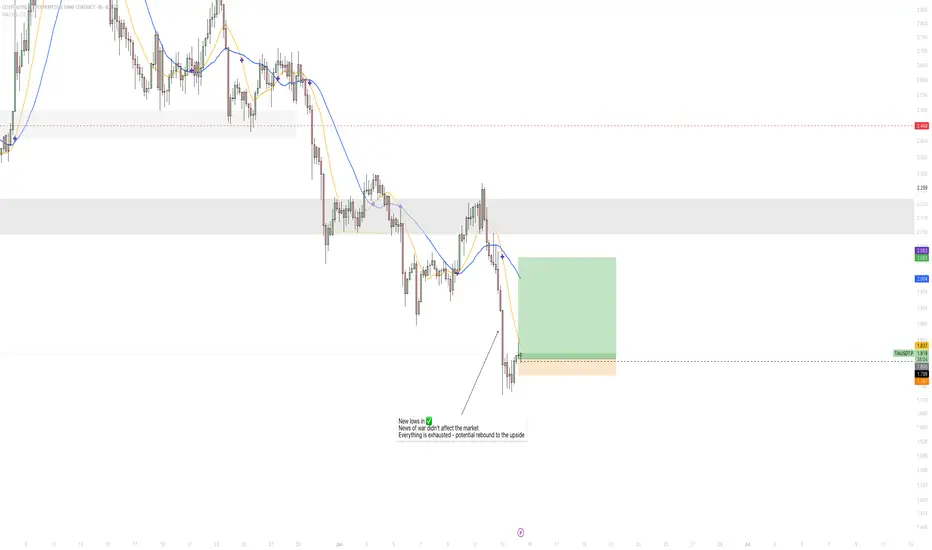
TIA/USDTLooking to execute this trade over the weekend. The dotted line is set for additional PO.
What I am keen to see is a reversal upon good news -- market seems quite exhausted so it might move easily to the upside.
TIAUSDT trade ideas
TIAUSDTTIAUSDT
SPOT
BUY NOW
LONG TERM
This is a personal analysis, it can and will have good growth potential.

Tia demand.Tia retraced to major demand zone, this could be an opportunity.
Golden pocket.
Equilibrium of the structure.
NFA

TIA/USDT Ascending ChannelThis chart of TIA/USDT on the 4-hour timeframe. Here's a breakdown of the chart and what it's suggesting:
1. Pattern: Ascending Channel
The price appears to be moving within an ascending channel (marked by two parallel trendlines).
The support and resistance levels of the channel are well defined, suggesting a bullish structure overall.
2. Current Price Action
Price is currently at $2.536, nearing the lower boundary (support) of the ascending channel.
There is a blue curved arrow, suggesting a bullish bounce off the support line and a move toward the upper boundary of the channel.
3. Trade Setup (Long Position)
Entry Zone: Near current level ($2.53), just above the support.
Stop Loss (Red Box): Below the channel support, around $2.15.
Target (Green Box): Near the top of the channel, around $3.80.
This sets up a favorable risk-to-reward ratio ( 1 : 5.5 )).
4. Support & Resistance
Key Support: ~$2.15 (stop-loss level), channel bottom.
Immediate Resistance: ~$2.75 (mid-channel zone).
Major Resistance (Target): ~$3.80 (channel top).
Conclusion
This chart suggests a bullish trade idea, based on:
Price rebounding from the bottom of a rising channel.
Strong risk-reward setup (target ~$3.80, stop ~$2.15).
If the support fails, the setup is invalidated with limited downside risk.

TIAUSDT: Trend in daily timeframeThe color levels are very accurate levels of support and resistance in different time frames, and we have to wait for their reaction in these areas.
So, Please pay special attention to the very accurate trend, colored levels, and you must know that SETUP is very sensitive.
Be careful
BEST
MT

TIA - Super Bullish For AltseasonBINANCE:TIAUSDT
𝐓𝐈𝐀/𝐔𝐒𝐃𝐓
TIA is coiling at the tip of a falling wedge — a breakout looks imminent. Eyes on the $3.31 level for a potential 107% move if bulls take charge

TIA analysisTIA has broken the downtrend line and the resistance area. You can open a long position at the retest of this zone. We may see a significant move in altcoins once BTC reaches a new all-time high.
Support Area: $2.05-$2.08

Tia scalp long to $2.08 Opened a scalp long position just now on Tia.
Targeting $2.08
Time sensitive.
Anticipating an impulsive push before next correction. If get correction now though I think it be a quick one and 1.979 stop should be sufficient

Celestia (TIA) – Ascending Triangle Setup (4H)BINANCE:TIAUSDT is printing a clean ascending triangle on the 4H chart, signalling a potential reversal.
Key Levels
• Support: Ascending trendline
• Resistance: $2.30 – a key level that acted as support since early April
• Measured Target: $2.50–$2.55 – aligns with prior support area
• Watch out for the longer-term descending trendline, which could act as resistance on breakout around ~$2.40
Breakout Trigger
A solid 4H close above $2.30 with convincing volume could confirm the move
Invalidation
A sustained break below the ascending support would fully invalidate the setup and potentially lead to a drop to $1.70

Tia bearish short term.To me the view is pretty clear.
* The purpose of my graphic drawings is purely educational.
* What i write here is not an investment advice. Please do your own research before investing in any asset.
* Never take my personal opinions as investment advice, you may lose your money.
Celestia TIA price analysis#TIA price currently looks “weak,” gradually sliding down and updating lows.
A “ray of hope” may be a repeat of the fractal behavior of the OKX:TIAUSDT price from last year, when, after the third slight update of the low, the price began to rebound upward.
If we take this fractal as a basis, then in the near future, the price of the #Celestia token should rebound to $4, followed by a correction and continued growth to $5.55.
_____________________
Did you like our analysis? Leave a comment, like, and follow to get more

TIA/USDT – Trendline breakout watchTIA/USDT – Trendline breakout watch
TIA has broken above the descending trendline, indicating a potential shift in momentum. If the price manages to hold above the breakout zone with stability, we can expect a bullish move ahead.
A successful retest and hold above the trendline could trigger a pump of around 15–30% in the coming sessions.
Key levels to watch:
* Breakout support zone
* Confirmation with volume
* Immediate resistance ahead
Monitor closely — holding the breakout could open the door for a solid upside move.

Tia pump to $2.2383Just recently opened a long position on tia.
Time sensitive.
Expecting a retest of $2.383 area before more down side or who knows maybe it continues.
Stop: $2.248
Roughly 3RR from my entry.
Perhaps still can get 2RR at the time of this post.
DTT setup strategy applied.

Tia Short ScalpPrice has broken below 20,50,100 ema on 15 min and after a long period of cosolidaton seems to now be trending see stop and tp on chart. roughly 1:3.5 rr
Tia long scalp to $2.718-2.77Just now hopped into a tia scalp long
Target as mentioned in title
Stop: $2.624 or lower
Time sensitive

Tia short to $2.387Gm, just went short on tia. I anticipate that the market will reverse completely and fall back down to $2.387 to make new lows this week. Where the market closed the weight isn't a demand zone thus I expect the market to continue to fall to that area in order to gain enough demand to actually pump and flip the daily trend back bullish. Current its bearish
Stop: $2.659 or higher

TIAUSDT 1D AnalysisTIA ~ 1D Analysis
#TIA Buy again from here if you still have confidence in this coin with a short term target of at least 15%+ from here.

TIAUSDT | Still No Buyers—Maintaining a Bearish Outlook
TIAUSDT has been one of today’s top volume movers, with 24‑hour trading volume hitting around $63.6 million—a 48.7 percent jump from the previous day.
Yet despite this surge, genuine buying interest remains absent, and price action is unable to find footing.
🔴 First Resistance: The Red Box
• This red box marks the first major zone where sellers have consistently defended price.
• Any rally into this area should be treated as a short opportunity—provided you see clear lower‑time‑frame breakdowns and CDV confirming sell‑side dominance.
📉 How Much Further Could It Fall?
I can’t predict the exact bottom—no one can. What I do know is that until buyers step up, downward pressure is likely to continue. Watch for each bounce to stall at resistance and use that as your cue to enter or add to shorts.
🤝 Key Trading Rules to Follow
Confirmation is Everything
Wait for a clean LTF breakdown inside the red box, with CDV divergence or rising sell volume. No confirmation means no trade.
Adaptive Bias
I will not insist on my short idea. If TIA breaks above this red box with volume and then retests it as support, I will shift to a long bias. Otherwise, my view stays bearish.
Risk Management
Keep stops just above the red box. Trade only what the market shows you—never chase.
This approach is built on watching real order flow and market behavior, not guessing. If you want to align yourself with a strategy that filters out noise and focuses on high‑probability setups, you’re in the right place.
📌I keep my charts clean and simple because I believe clarity leads to better decisions.
📌My approach is built on years of experience and a solid track record. I don’t claim to know it all but I’m confident in my ability to spot high-probability setups.
📌If you would like to learn how to use the heatmap, cumulative volume delta and volume footprint techniques that I use below to determine very accurate demand regions, you can send me a private message. I help anyone who wants it completely free of charge.
🔑I have a long list of my proven technique below:
🎯 ZENUSDT.P: Patience & Profitability | %230 Reaction from the Sniper Entry
🐶 DOGEUSDT.P: Next Move
🎨 RENDERUSDT.P: Opportunity of the Month
💎 ETHUSDT.P: Where to Retrace
🟢 BNBUSDT.P: Potential Surge
📊 BTC Dominance: Reaction Zone
🌊 WAVESUSDT.P: Demand Zone Potential
🟣 UNIUSDT.P: Long-Term Trade
🔵 XRPUSDT.P: Entry Zones
🔗 LINKUSDT.P: Follow The River
📈 BTCUSDT.P: Two Key Demand Zones
🟩 POLUSDT: Bullish Momentum
🌟 PENDLEUSDT.P: Where Opportunity Meets Precision
🔥 BTCUSDT.P: Liquidation of Highly Leveraged Longs
🌊 SOLUSDT.P: SOL's Dip - Your Opportunity
🐸 1000PEPEUSDT.P: Prime Bounce Zone Unlocked
🚀 ETHUSDT.P: Set to Explode - Don't Miss This Game Changer
🤖 IQUSDT: Smart Plan
⚡️ PONDUSDT: A Trade Not Taken Is Better Than a Losing One
💼 STMXUSDT: 2 Buying Areas
🐢 TURBOUSDT: Buy Zones and Buyer Presence
🌍 ICPUSDT.P: Massive Upside Potential | Check the Trade Update For Seeing Results
🟠 IDEXUSDT: Spot Buy Area | %26 Profit if You Trade with MSB
📌 USUALUSDT: Buyers Are Active + %70 Profit in Total
🌟 FORTHUSDT: Sniper Entry +%26 Reaction
🐳 QKCUSDT: Sniper Entry +%57 Reaction
📊 BTC.D: Retest of Key Area Highly Likely
📊 XNOUSDT %80 Reaction with a Simple Blue Box!
📊 BELUSDT Amazing %120 Reaction!
I stopped adding to the list because it's kinda tiring to add 5-10 charts in every move but you can check my profile and see that it goes on..

Tia short o $2.39Just now opened a short trade on tia.
Target: $2.39
Roughly 3RR from my entry.
Time sensitive.
Anticipating impulsive break to downside

TIA NEXT TERMMy scenario is like this.
* The purpose of my graphic drawings is purely educational.
* What i write here is not an investment advice. Please do your own research before investing in any asset.
* Never take my personal opinions as investment advice, you may lose your money.

The key is whether it can rise above 3.211
Hello, traders.
If you "Follow", you can always get new information quickly.
Have a nice day today.
-------------------------------------
(TIAUSDT 1D chart)
The basic trading strategy is to buy near the HA-Low indicator and sell near the HA-High indicator.
However, if the HA-Low indicator falls, there is a possibility of a stepwise downtrend, and if the HA-High indicator rises, there is a possibility of a stepwise uptrend.
Therefore, when the HA-Low indicator is first created, the probability of rising is higher than the probability of falling, and when the HA-High indicator is first created, the probability of falling is higher than the probability of rising.
If the HA-Low indicator rises and then meets the previously formed HA-Low indicator again, the probability of falling is higher.
On the contrary, the HA-High indicator has a higher probability of rising.
You should check the movement of the chart with these characteristics in mind.
However, you should comprehensively judge the correlation between the OBV indicator and the StochRSI indicator.
-
From a trend perspective, since the M-Signal of the current 1D chart is < M-Signal of the 1W chart, you can see that it is in a reverse arrangement.
Therefore, when trading in a reverse arrangement, it is recommended to trade for a short period of time using day trading.
Therefore, if it shows a price that rises above the M-Signal indicator of the 1W chart and maintains the price, it is highly likely that a trend will be formed that can be traded.
In other words, when looking at the current price position, it can be seen that it can be traded for a short period of time or longer only when it rises above 3.211 and shows support.
-
Since the HA-Low indicator is formed at the 2.490 point, the price must be maintained above this point.
If not, there is a possibility of an additional stepwise downtrend, so you should think about a countermeasure for this.
-
If the average purchase price is significantly higher than the current price, you should not buy too much and increase your investment ratio.
In this case, it is better to trade with a relaxed mind and faithfully follow the basic trading strategy.
However, it is better to trade by increasing the number of coins (tokens) corresponding to the profit realization method and increasing the number of coins (tokens).
In other words, trade by purchase price.
If you bought 100 USDT at the current price of 2.840, you should sell 100 USDT when the price rises and shows resistance at 3.211.
In this case, only the number of coins (tokens) corresponding to the profit will remain.
At this time, you should be careful about the transaction fee.
Since you have to sell the purchase amount including the transaction fee, the actual selling amount when you place an order is not 100 USDT.
The transaction fee rate varies depending on the exchange.
For example, if the trading fee is 0.1%, you can trade 100USDT - (100USDT x 0.2%) = 99.8USDT.
-
Thank you for reading to the end.
I hope you have a successful trade.
--------------------------------------------------
- Here is an explanation of the big picture.
(3-year bull market, 1-year bear market pattern)
(3-year bull market, 1-year bear market pattern)
I will explain the details again when the bear market starts.
------------------------------------------------------

TIAUSDT: Multi-Timeframe Analysis (4H-15m)positioned after a confirmed rejection from a high-probability bearish reversal zone (OTE/Liquidity Voids). This reinforces the overarching bearish market structure established on higher timeframes.

My personal analysis and opinion for TIAIt's just a personal opinion
According to the news, any process can be ruined.
Good luck
