Tia to dump even more todayJust recently opened a short position on Tia. targeting $2.391 rea
Market tried to pump today but got rejected strongly , flipping to a downtrend structure on lower tf signaling that the correction is not over.
$2.391 seems to be the next most probable target to fall to- weekly support area as we approach weekly closure
TIAUSDT trade ideas

TIA long Close to range lows again in key area box, run it up to range mid normal scale or make new lows

Tia swing long back to $3.335Just opened a swing long position on #Celestia
🎯Target: $3.335
🛑Stop: $2.614 or lower
#tiausdt #tia LSE:TIA

$TIA pullback looks healthy for next leg up !!LSE:TIA is retesting the breakout zone perfectly
After a clean breakout from the falling wedge structure, the price is now pulling back into the key demand area.
I expect this zone to hold and if it does, we could see a strong move toward $5+ in the coming days.
Keep a close eye on this level, the next move could be explosive! 🚀
Like & Retweet if you're bullish!
#TIA #CRYPTOMOJO_TA


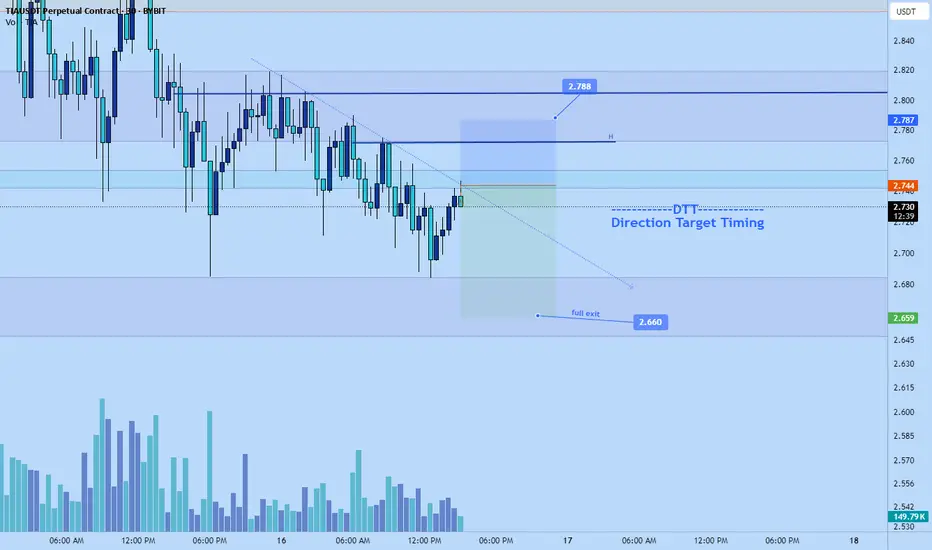
Tia scalp short to $2.66 today!Entered #tia scalp short just now
Target: $2.66
Roughly 2RR
Stop: $2.787 or higher
the fish pattern on the TIA USDT as described ont the chart/
the entry zone are mentionned in the chart in green lines
DYOR NFA .
Happy trading

TIA : last dump before mooningafter analysis as described on the chart tia will vsiist the 1$ levels.
Place the trade as described in the chart :
i m not putting any stop lose :
i enter with 50% of the capital :
each small dump i add a 10% from the first capital so i have 5 more entries:
=======> this is not a financial advice .
happy trading for u all and happy day

TIA SIGNALSHello friends
As you can see, this currency has a beautiful chart and the technical analysis we did is that if the valid resistance is broken, we can open a buy trade with capital and risk management and move with it to the specified targets.
*Trade safely with us*

Tia scalp short to $3.233Just now opened a scalp short position on tia. Targetting 3.233 area
Time sensitive
$3.42 stop or higher
Roughly 2RR from my entry. Likely lower for anyone just seeing this unless use tighter stop

TIA Breakout confirmed.Successfully breakout this resistant line with a short -term target of at least +10%

Celestia is dumping before bulish seasonas described on the chart we will see the last bearish season to the the green zone before goin up as described
NOT FA DYOR
happy trading
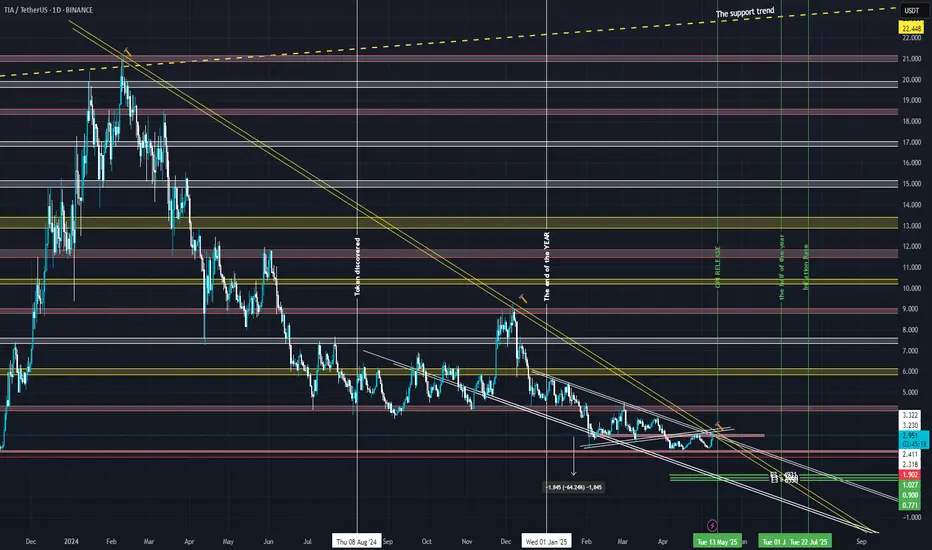
TIA/USDT Weekly Analysis – Is a Breakout Brewing?TIA has been in a multi-week downtrend, respecting the red descending channel. Recently, it's been holding support in the $2.17–$2.25 range (green zone). Price has tested this zone multiple times and is showing signs of stability here.
To flip bullish, TIA needs to break above the $2.88 resistance zone (red trendline). That would be the first real sign of a trend shift.
If it clears $2.88 with volume, the next target is around $4.50 — which lines up with a previous supply zone and offers around 45% upside from the breakout.
Still inside the broader downtrend channel, so we need to stay cautious until we see a proper breakout and retest. Losing the $2.17 support zone could lead to further downside into the lower green trendline.
Key levels:
Support: $2.17 – $2.25
Resistance: $2.88 (trendline)
Target after breakout: ~$4.50
Watching closely for a breakout or breakdown from this range.

TIA long range highs TIA long 5.7R final Tp hit on range mid log scale. Looking for a rejection into range mid normal scale -> reclaim -> range highs with 12345 EW

TIA Secondary trend. Wedge. Reversal zone. 09 05 2025Logarithm. Time frame 3 days. The price dropped to the listing price zone, namely the level of 2.309. In this zone, the decline stops and the transition to consolidation - sideways. The decline formed a full-fledged descending wedge. This is a bullish pattern in cases of a breakthrough of its resistance (in most cases).
When working with such hype cryptocurrencies, observe money management. Now in “investors” more than 200-300 X, who always sell without loading the glass, but somewhere more, and somewhere less, under the market as a whole. I would advise you to work with the wedge that has now formed and "down-to-earth", logical goals, after exiting it and the consolidation zone.
Main trend. TIA (Celestia) Main trend. Maximum targets of the cycle. XXL+10Х
Line chart of prices, for clarity of the secondary trend, the descending wedge and the potential reversal zone.

Celestia: Easy New ATH $33 & Mid-Term Target $14 (TAC-S6)Good afternoon my fellow Cryptocurrency genius, you have great timing and also a great choice here.
Celestia's bottom came in just a month ago, 7-April. This date is the same date when the entire Cryptocurrency market hit bottom, with some exceptions of course.
After the low 7-April TIAUSDT starts to recover but very slowly. Notice that there is no big volume candles after this low.
Now, today, notice the difference... The big green candle is supported by really high volume after a local higher low. This confirms the 7-April low as the corrective cycle bottom and thus the start of a bullish phase.
Growth will be really strong for this pair, really strong... It will be amazing that I am certain of. You can count on it.
» The first target is very easy and reaches $14 ($13.88). Profits potential from current price is 410%.
» The second target is a new All-Time High at $33 ($32.88) and this one while a new ATH should be easy to hit. High probability I mean. Profits potential reaches 1,109%. That's more than 12X.
So, all is good. Timing is right, the price is right... A great Top Altcoin Choice (TAC).
Thanks a lot for your support.
Namaste.

Celestia swing long tradeJust now opened this swing long trade position on tia. Didn't get the most sniper entry and there might be another correction but didn't want to miss it so decided to take a swing long position. Perhaps later on in time I'll scale in a bit.
Targeting $3.00 area
$2.369 stop or lower
Roughly 6RR. Might take partials along the way

TIAUSDT 2D AnalysisTIA ~ 2D Analysis
#TIA Buy gradually from here if you still have confidence in this coin with a short term target of at least 20%+ from here

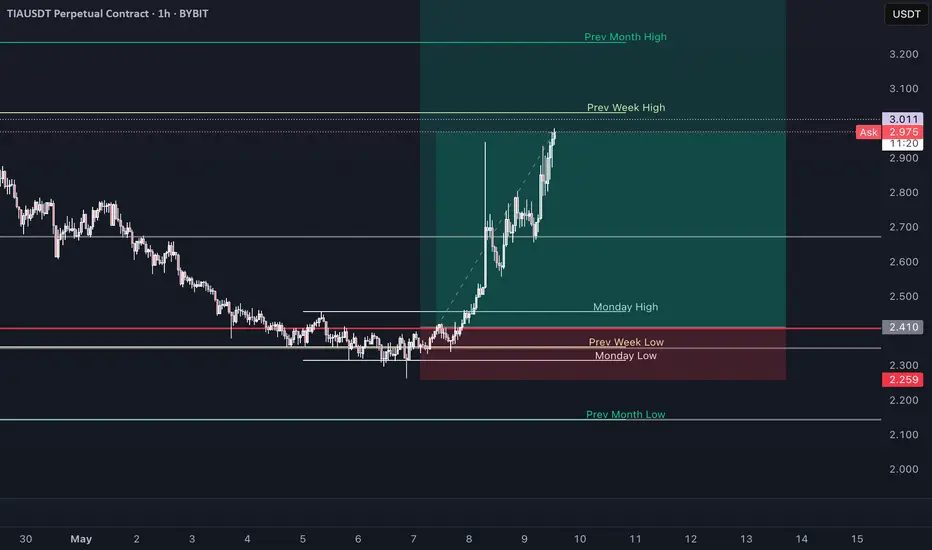
TIA/USDT BULLISH reversal from Fibonachi GOLDEN ZONE📈 TIA/USDT – 4H Analysis (BINANCE)
🟢 Bullish Reversal Setup Identified
Price has tapped into the Fibonacci golden pocket (0.705–0.79) and shown a strong reaction from the demand zone at $2.32–$2.34. A clean bounce suggests potential upside towards the previous high at $3.03.
🎯 Trade Plan:
Entry: $2.34 – $2.36
TP: $3.03
SL: $2.17
Risk-Reward: ~3.5R
❗DO YOUR OWN RESEARCH

TradeCityPro | TIA: Key Support Test in Cosmos-Based Token👋 Welcome to TradeCity Pro!
In this analysis, I want to review the TIA coin for you. This project is one of the protocols in the Cosmos ecosystem and currently ranks 53 on CoinMarketCap with a market cap of $1.51 billion.
📅 Daily Timeframe
As you can see on the daily chart, there's a descending trendline, and the price has been moving down along with it. Currently, the price has reached its main support zone at 2.274.
✨ This is the most critical support for this coin, and if it breaks, the price will move toward a new all-time low. So, buyers will do everything they can to protect this support.
💥 If the price gets supported at this level, the first trigger for opening a long position would be the breakout of the descending trendline. That trigger level is the break of 2.956.
🛒 You can also use this trigger for spot buying. The main trend reversal confirmation comes with a break above 4.324. However, in any case, if any of these triggers are activated, I personally will wait for Bitcoin dominance to show a trend reversal before buying altcoins on spot using the first solid trigger I find.
🔽 For short positions, the key point to remember is that the trend is already downward, so we don’t need a trend reversal confirmation to go short.
⭐ The short trigger is very clear and straightforward — if the 2.274 level breaks, you can enter a short position. Additionally, a pullback to the trendline can also be used as an entry point.
📝 Final Thoughts
This analysis reflects our opinions and is not financial advice.
Share your thoughts in the comments, and don’t forget to share this analysis with your friends! ❤️

Tia short down to $2.28 todayJust now opened a short position on tia. I anticipate continuation fall towards $2.28
Time sensitive.
Stop and partials on chart

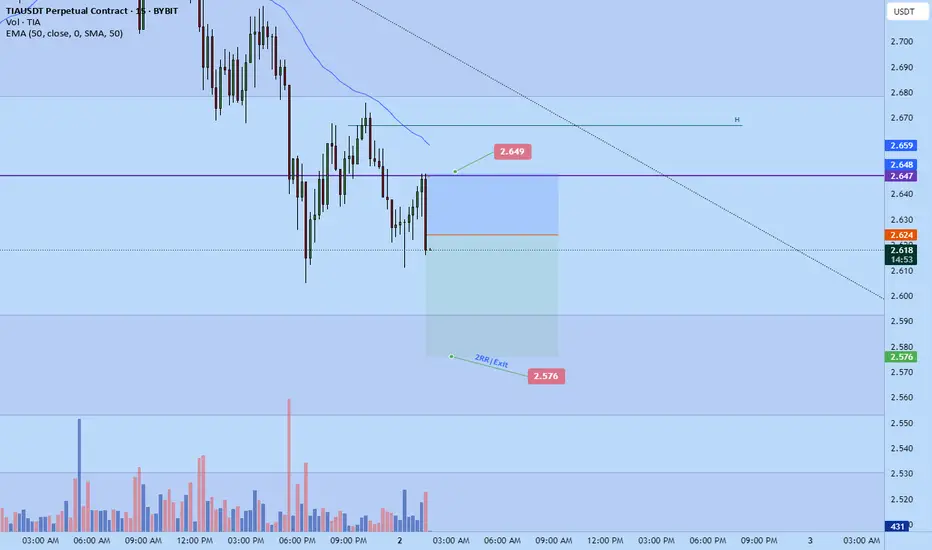
Tia scalp short to $2.576Just now opened a scalp short on Tia. Time sensitive.
2RR
Stop: $2.649
Target; $2.576