TIAUSDT: Ascending triangle formation!!Join our community and start your crypto journey today for:
In-depth market analysis
Accurate trade setups
Early access to trending altcoins
Life-changing profit potential
Let's analyze TIAUSDT on LFT:
TIA is in an ascending triangle, facing $3.67-$3.72 resistance. A breakout targets higher zones. A drop below $3.42 after triangle breakdown signals bearish mode. Watch for price action at these key levels for trading decisions.
Entry: CMP to $3.55
SL: close below $3.42
Target:
$4.09
$4.48
If you find this analysis helpful, please hit the like button to support my content! Share your thoughts in the comments and feel free to request any specific chart analysis you’d like to see.
Happy Trading!!
TIAUSDT trade ideas

Tia long to $4.06Opened a long position just now on Tia . I anticipate that the market will breakout and rally to $3.902-$4.060 today based on my DTT edge.

TIAUSDT – Weak at Key Weekly Level! More Downside Ahead?TIAUSDT – Weak at Key Weekly Level! More Downside Ahead?
“This chart looks weak—momentum favors the downside. But is there a bounce first?”
🔥 Key Insights:
✅ Sitting at a Critical Weekly Zone – A breakdown here could be brutal.
✅ Momentum Looks Bearish – No real strength from buyers.
✅ Only Considering Low-Risk Buys – Fibonacci Green Zone (0-0.5) is the ideal cheap area.
💡 The Smart Plan:
Looking for a Break & Retest Downward – If support cracks, shorts become clear.
Small Risk Buys from the Fibonacci Zone – Only for aggressive traders.
CDV & Volume Profile Must Confirm – No buyers? No trade.
“Weak price action, heavy risk. Only the right levels matter here—watch closely!” 📉🔥⚠️
A tiny part of my runners;
🌊 WAVESUSDT.P: Demand Zone Potential
🟣 UNIUSDT.P: Long-Term Trade
🔵 XRPUSDT.P: Entry Zones
🔗 LINKUSDT.P: Follow The River
📈 BTCUSDT.P: Two Key Demand Zones

TIAUSDT analysisWell TIA reached nice POI
The only thing that makes me doubt about that is the overall trend of the crypto market and the deeper POI’s that I want to see much lower but I’ll take that trade

Tia USDT short back to $3.366Just now opened a short position on TIAUSDT
Targeting $3.366 for full close.
DTT strategy applied.

TIA | PERFECT Bottom??In the macro, it's clear that TIA has been in a downward trend for an extended period of time. This means, it's a great place to buy - because the bullish cycle is up next.
Trend based indicators are great to identify the immediate predominant pressure on the chart, in this case, bearish. A "Buy" signal in the weekly timeframe would be the first step in the right direction (reversal).
Trend Based Indicator:
Another key indicator to watch is the daily timeframe, when the price begins to trade ABOVE the moving averages - that's when you'll have the first confirmation of a bullish turn around.
Moving Averages:
______________________
BINANCE:TIAUSDT

#TIAUSDT.P - QUICK SHORT SCALPING"I've shown it on the chart, no need for much explanation. Just a quick scalp position for the night."
Breaking: $TIA Surges 17% Eyeing A Move to $5 The first modular blockchain network that enables anyone to easily deploy their own blockchain with minimal overhead by rethinking blockchain architecture from the ground up broke out of a falling wedge patten soaring 17% albeit the crypto market is highly volatile with CRYPTOCAP:BTC reclaiming the FWB:83K pivot.
Celestia Network Native token ( LSE:TIA ) has shocked the mainstream crypto market after breaking out of a falling wedge escaping the gasp of the support point holding it at the $2 zone.
With building momentum, LSE:TIA is eyeing a move to the $5 zone should it break the $4 resistant zone a move to the $5 target isn't far-fetched. With the Relative Strength Index (RSI) at 58, LSE:TIA is poised for a bullish run should the crypto market stabilize.
Celestia Price Live Data
The live Celestia price today is $3.74 USD with a 24-hour trading volume of $220,357,891 USD. Celestia is up 17.41% in the last 24 hours. with a live market cap of $2,091,803,371 USD. It has a circulating supply of 558,964,944 TIA coins and the max. supply is not available.

TIA Looking Good To Short Failed Break Down Of Raising Wedge TIA Looking Good To Short Failed Break Down Of Raising Wedge Not Looking Good Potential For Breaking Out But It's With Less Risk Play Simple And Profitable

Celestia TIA price analysis🟣 For the second day in a row, the LSE:TIA price is showing growth
But would we risk buying OKX:TIAUSDT now - rather no than yes...
🟡 Above the orange trend line, purchases will be safer.
🟢 And during the $3 retest in the blue scenario, it's even safer)
Although, in the medium term, seeing #Celestia at $9 again is more than a realistic task.
_____________________
Did you like our analysis? Leave a comment, like, and follow to get more

TIA Trade Setup: Potential Double Bottom FormationWith seller exhaustion possibly setting in, TIA is shaping up for a double bottom formation. If price deviates from launch levels and confirms a market structure shift, we could see a strong upside move.
🛠 Trade Details:
Entry: Around $4.00
Take Profit Targets:
$5.50 (First TP - Key Resistance Zone)
$7.10 (Second TP - Breakout Level)
$9.00 (Third TP - Full Expansion Target)
Stop Loss: Below $3.00
Keeping an eye on volume confirmation and resistance reclaim before full conviction. 🚀

NEW TRADE ON CELESTIA new trade on celestia as described on the chart :
dyor
happy trading for you all
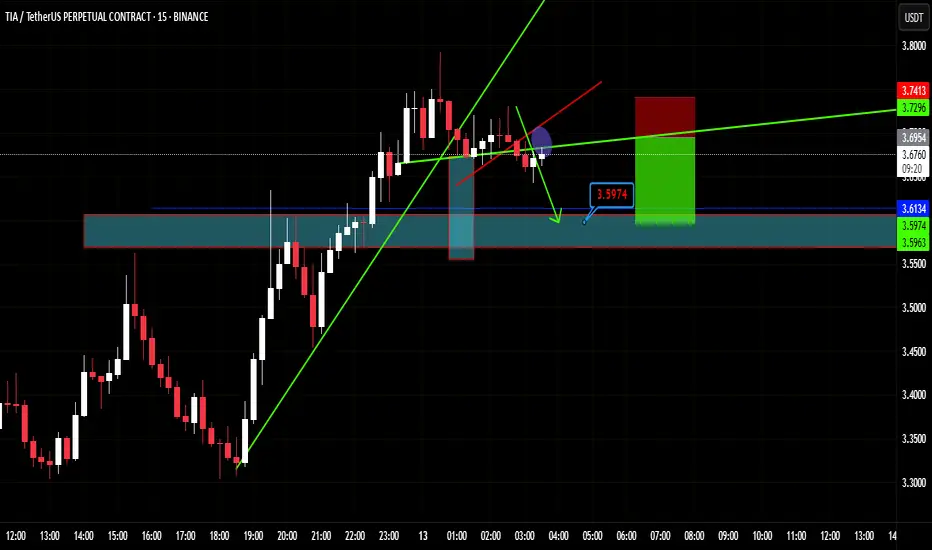
TIA short back to $3.00I just now opened a short trade on TIa. Am anticipating a big drop back to $3.00 this weekend and right here where am shorting might be the top.
This setup however isnt' in full alignment with my DTT strategy. Direction, Target and Timing.
I still would need to wait a bit for the perfect timing scenario to to playout but I identified some other confluences that suggest i could make an exception here and enter so using a bit of discretion, we'll see how it plays out. Am still confident in the setup.

TIA LONG ALL trading ideas have entry point + stop loss + take profit + Risk level.
hello Traders, here is the full analysis for this pair, let me know in the comment section below if you have any questions, the entry will be taken only if all rules of the strategies will be satisfied. I suggest you keep this pair on your watchlist and see if the rules of your strategy are satisfied. Please also refer to the Important Risk Notice linked below.
Disclaimer


Tia short to $3.00 againI just recently opened a short on celestia. Anticipating another big dump likely back to $3.00 area
Going to bed now so will set tp at $3.029.
Its relatively far tp so tomorrow I'll likely tighten my stop and scale into the position

TIAUSDThi friends...
enjoy the TA
tell me your idea please in comments
i used order block & price action & Ichimuko to make this position
best regards
we may get stopped. you can open it again thenT or use bigger SL in 4.09 area

$TIAUSDT | Long from #1D Block📌 Current Situation:
Confirmed Rebound: The price initially broke below the 1D support (deviation), but yesterday’s daily close confirmed a level reactivation.
Reversal Pattern Formation: A potential double bottom or an Inverse Head and Shoulders is developing.
🎯 Trading Plan:
🔹 Entry Zone: Limit orders on the retest of the 1D block at $3.82 - $3.64.
🔹 Stop-Loss: Below $3.53.
🔹 Target: Upside towards $6.00+ (liquidity zone).
📈 Justification:
✅ 1D Block Support: The price is retesting a key daily demand zone.
✅ Deviation and Rebound: A classic trend reversal model after weak long liquidations.
✅ Risk/Reward: Well-defined R/R ratio with a clear invalidation level.
💡 Conclusion:
LSE:TIA is showing strong signs of recovery, but it's crucial to wait for the retest before entering the trade. Given the broader market context, the chances of a successful long setup appear promising. 🚀

Celestia Short-Term Bullish Target Goes Beyond 200%This is another pair that is bullish and is now about to produce a strong advance while Bitcoin crashes. Bitcoin isn't going any lower, or, I should say, TIAUSDT is about to move up.
TIAUSDT is trading above EMA8 and EMA13 on the daily timeframe.
The previous peak happened in February 2024.
The most recent bottom happened in February 2025. That's a full year of bearish action.
There was a strong correction in the form of a bearish impulse. This bearish impulse was followed by a sideways market. The sideways market produced a small bullish breakout and later a lower low to reach this present day. Present day, TIAUSDT is bullish and about to go up. The targets can be found on the chart. Here we have an easy 216% target and up to 378% short-term.
Thank you for reading.
Namaste.

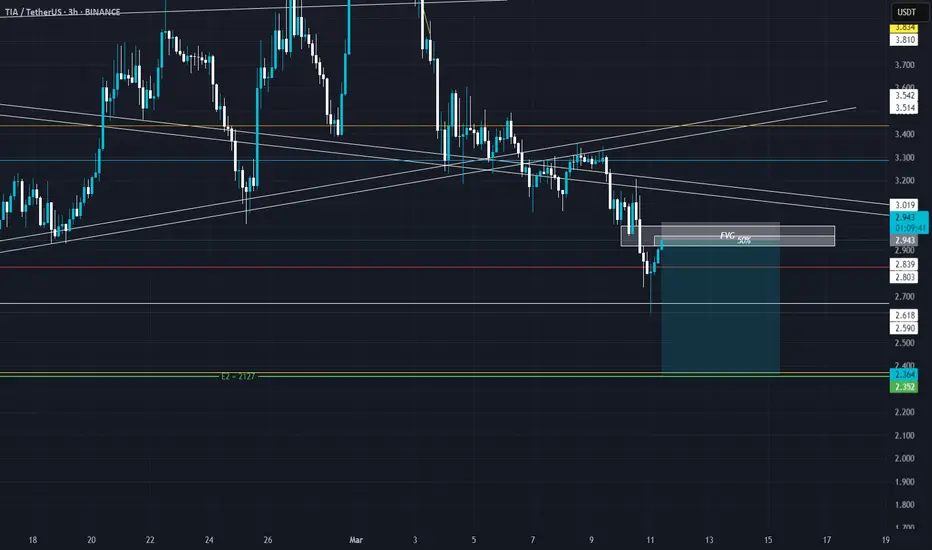
TIA LONGTaking a long inside the obvious demand zone and a HTF FVG in LSE:TIA , I expect it to get filled within a few days, if not I will reshare a new plan. TP and SL are visible on the chart

celestia new dip incoming if btc close below 85Kif btc close below 85K we will see tia dumping as demonstrated on the chart .
DYOR and NFA .
Happy trading for u all .

TIAUSDT - Tears apart!I wonder what made TIA BOOOM, But not here, OPT for small scalps throughout and follow for the nPoC

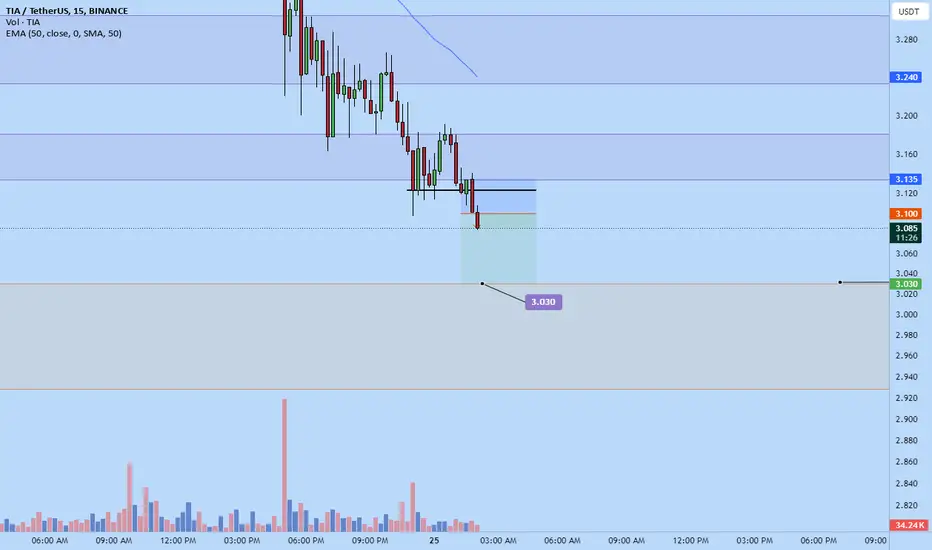
Tia scalp shortJust opened this scalp short on tia a while ago.
Target $3.030 area.
Time sensitive, already moving away