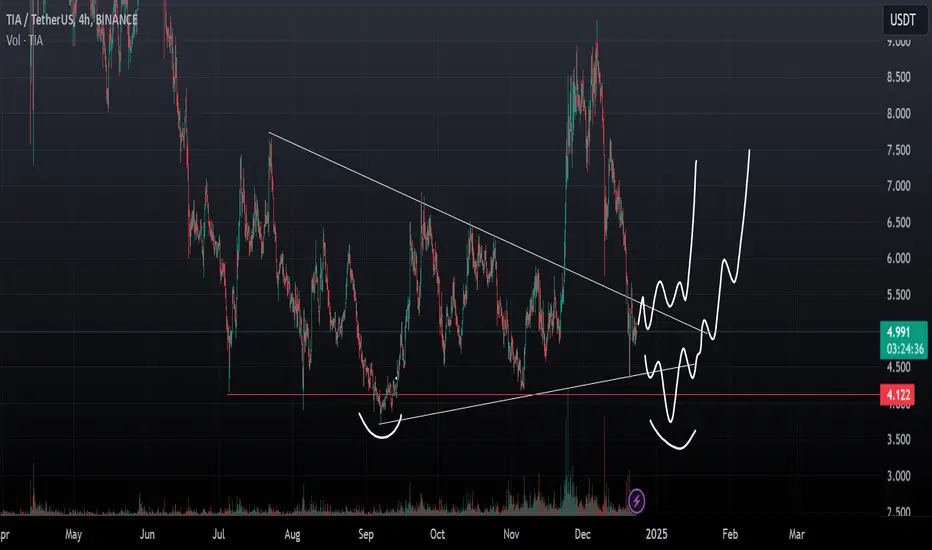
TIA - Bullish Pullback into SupportMACD and RSI Bullish crossover imminent as the price action back tests the breakout of descending trendline.
TIAUSDT trade ideas

TIATrendline Respect: The price has shown consistent respect for the established trendlines within the descending channel. These trendlines have acted as significant guides for the price movement, reflecting a clear structure in the market's behavior.
Potential Breakout: As the price narrows near the convergence of the descending trendline and support, there is a strong likelihood of a bullish breakout.
Future Movement: If the breakout occurs above the descending trendline, the price could see a sharp upward movement, potentially targeting higher resistance levels. This is depicted in the chart as a zig-zagging upward projection.
Confirmation Needed: Before any sustained bullish movement, confirmation of the breakout above the resistance trendline is critical. Traders should wait for price stability and volume increase as validation of the breakout.

#TIA (SPOT) entry ( 4.200- 4.800) T.(14.000) SL(4.161)BINANCE:TIAUSDT
#TIA/ USDT
Entry ( 4.200- 4.800)
SL 1D close below 4.161
T1 6
T2 10
T3 14
______________________________________________________________
Golden Advices.
********************
* collect the coin slowly in the entry range.
* Please calculate your losses before the entry.
* Do not enter any trade you find it not suitable for you.
* No FOMO - No Rush , it is a long journey.
Useful Tags.
****************
My total posts
www.tradingview.com
1Million Journey
www.tradingview.com
www.tradingview.com
**********************************************************************************************
#Manta #OMNI #DYM #AI #IO #XAI #ACE #NFP #RAD #WLD #ORDI #BLUR #SUI #VOXEL #AEVO #VITE #APE #RDNT #FLUX #NMR #VANRY #TRB #HBAR #DGB #XEC #ERN #ALT #IO #ACA #HIVE #ASTR #ARDR #PIXEL #LTO #AERGO #SCRT #ATA #HOOK #FLOW #KSM #HFT #MINA #DATA #SC #JOE #RDNT #IQ #CFX #BICO #CTSI #KMD #FXS #DEGO #FORTH #AST #PORTAL #CYBER #RIF #ENJ #ZIL #APT #GALA #STEEM #ONE #LINK #NTRN #COTI #RENDER #ICX #IMX #ALICE #PYR #PORTAL #GRT #GMT #IDEX #NEAR #ICP #ETH #QTUM #VET #QNT #API3 #BURGER #MOVR #SKL #BAND #ETHFI #SAND #IOTX #T #GTC #PDA #GMX #REZ #DUSK #BNX #SPELL #POWR #JOE #TIA

3 Emerging Crypto to watch in 2025Since you enjoyed my previous post about 3 Crypto OGs to watch this month...
Here's an interesting one about 3 Emerging Crypto to watch in 2025:
BINANCE:ARBUSDT
ARB rejected a strong a strong support and demand zone marked in red.
Waiting for a break above $0.85 structure marked in blue to activate the next bullish impulse towards the $1.5 mark.🎯
BINANCE:TIAUSDT
TIA rejected a strong a strong support and demand zone marked in red.
Waiting for a break above $5.7 structure marked in blue to activate the next bullish impulse towards the $10 mark.🎯
BINANCE:MKRUSDT
MKR rejected a strong a strong support and demand zone marked in red.
Waiting for a break above $1700 structure marked in blue to activate the next bullish impulse towards the $2500 mark.🎯
Which altcoins would you like me to cover next?
All Strategies Are Good; If Managed Properly!
~Rich


TIA Confusing PatternTIA back to inside triangle area after performing double top
This is confuse cz back to range area of accumulation zone
With massive downside before i think it could be time if this coin pumping again
many market makers still want to accumulate more
TIA Head and ShouldersKUCOIN:TIAUSDT price action suggests that it is retesting the neckline of a reversal pattern Head and Shoulders with potential to hit 20.7. Use spot to buy not futures. NFA. DYOR.

$tia- swing at range low
rsi reset
btc dominance hopefully makes a Lower High and then we get some relief on alts
still feel this is max opportunity just squeezed and humbled us a bit
close above white line on daily and we good

TIA Head and ShoulderTIA massive pullback create HnS pattern, we will see the price is arround $5 to fill in gap before bouncing


$TIA/USDT Trading IdeaTIA/USDT seems to have experienced a pullback after a clean breakout from the falling wedge pattern. I believe the price will find support within that gap and, one way or another, has a strong chance of reaching the golden zone. There’s potential for another 100% rally to the upside.

TIA daily chart idea
really nice bottoming structure as we retrace to the local Weekly FVG
have a HTF bat harmonic that is starting to play out & a MTF cypher which already ran
looking for continuation here from Weekly FVG below + retest of ice line at 5.75
could wait for H4 shift back to upside to look to get involved

$TIAUSDT 2X trading ideahello everyone, here is the my trading plan for $TIA. It can easily give 2X profit. Adding right now to my portfolio, Pls do not miss this huge gain opportunity.
** Please show your support if you like to see more idea from me. LIKE 👍, FOLLOW ✅, SHARE 🙌 and COMMENT ✍ if you enjoy this idea! Also share your ideas and charts in the comments section below! This is best way to keep it relevant, support me, keep the content here free and allow the idea to reach as many people as possible. **
#trading #BTC #bitcoin #coin #scalping #crypto

Celestia (TIA/USDT) - "LONG" Spot Margin Trade📈 LONG
Signal Type: (SPOT) ⬆️
💵Margin: 2%
✅Entry level:
$6.2 - $6.9
🎯Target Levels:
1) $7.7
2) $8.8
🚫Stop Loss: $5.749
💰 Leverage (Optional)
‼️Risk= Medium
⚠️Please use the risk management I provided for you accordingly and don't forget about the risk in futures trading. Be sure to adjust Stop Loss/Leverage to your needs.

$Tiausdt ready set goHi everyone, One of my follower requested to analyze $Tia. I realized really good setup on that. So Im expecting around 90% profit on this coin.
here is my buy and sell prices.
** Please LIKE 👍, FOLLOW ✅, SHARE 🙌 and COMMENT ✍ if you enjoy this idea! Also share your ideas and charts in the comments section below! This is best way to keep it relevant, support me, keep the content here free and allow the idea to reach as many people as possible. **
#trading #BTC #bitcoin #coin #scalping #crypto

TIAUSDT Elliott Waves (Local Setup)Hello friends.
Please support my work by clicking the LIKE button👍(If you liked).
Everything on the chart.
Entry zone: market and lower
Targets: 10 and 12.5
after first target reached move ur stop to breakeven
Stop: under 5.7 (depending of ur risk).
ALWAYS follow ur RM
risk is justified
It's not financial advice.
DYOR!

TIA : Long Possible targets essentially in wave 5TIA is on fire after wave 4 and looks like it will go for a good move above $11.00 .
All profit taking points are marked.

TIA / USDT : poised for a breakout as it approaches resistance tia/usdt: poised for a breakout as it approaches trendline resistance
TIA/USDT is gearing up for an intriguing move 📈 as it holds a crucial middle support level and heads towards trendline resistance 📊. The price action suggests a potential breakout could be on the horizon 💥. If this breakout occurs, we might witness a robust bullish trend emerge 🚀. Keep a close watch 👀 on this pair and wait for confirmation before taking action.
Key insights:
1. Middle support: TIA/USDT is currently maintaining a key support level, which could provide a solid foundation for the upcoming rally.
2. Trendline resistance: The pair is nearing a significant trendline that has capped upward movements in the past. A breach above this could signal a strong upward trajectory.
3. Bullish indicators: Momentum indicators, including RSI and MACD, are showing positive trends ⚡, bolstering the case for a breakout.
Steps to confirm the breakout:
- Monitor for a clear 4H or daily candle closing above the trendline 📍.
- A notable increase in trading volume during the breakout can indicate strong buyer interest 📊.
- A retest of the broken resistance turning into a new support area will add validity to the move ✅.
- Stay alert for potential false breakouts, such as sudden reversals or wicks above the trendline ⚠️.
Risk management strategies:
- Implement stop-loss orders to manage risk effectively 🔒.
- Ensure your position sizing aligns with your overall trading strategy 🎯.
This analysis is for educational purposes only and not financial advice. Always conduct your own research (DYOR) 🔍 before making investment decisions.


AAVE to $840Based on the weekly chart (1W) for the AAVE/USDT pair, here are the predicted support and resistance areas that can be identified:
Support Levels:
Support 1: 175–190 USD
This zone is seen as a blue Area of Interest (AoI) with high volume below the current price. This level is likely to be an accumulation area if the price corrects.
Support 2: 135–150 USD
A lower support area based on historical movements. This zone is important to maintain the long-term bullish structure.
Support 3: 105–110 USD
Key support based on the long accumulation range in 2023. If the price falls to this level, it could be a great opportunity for long-term buying.
Resistance Levels:
Resistance 1 (Initial Target): 275–280 USD
This is the current level being tested, and breaking it will be a confirmation to continue the bullish trend. Resistance 2 (Intermediate Target): 365–380 USD
Located near the 0.382 Fibonacci level, this is an intermediate target if the price manages to break through 275 USD.
Resistance 3 (Main Target): 840–1,000 USD
The next major target is near the red zone (Area of Interest) on the chart. This level is an important psychological resistance that will attract traders' attention.
Strategy for Price Movement:
Bullish Scenario: If the price breaks through 275 USD with high volume, the potential for an increase to 365 USD and then to 840–1,000 USD is very possible.
Bearish Scenario: If the price fails to break through 275 USD and corrects, the potential for a decrease to support at 175–190 USD or even 135–150 USD should be considered as an accumulation opportunity.
Monitor additional indicators such as volume and momentum (RSI/MACD) for trend validation. Also make sure to use good risk management, such as a stop loss below a key support level.
CRYPTOCAP:AAVE BINANCE:AAVEUSDT CRYPTOCAP:TOTALDEFI CRYPTOCAP:OTHERS

$TIA Hitting our Point of InterestJust an update on the analysis shared on November 27.
The setup has unfolded perfectly, with TIA dropping 42% from the rejection at the yearly VWAP. It deviated and bounced at $5.37, aligning with our identified accumulation range.
What we’re looking for now is the formation of a bottoming structure at this level.
Key levels:
- Strong support: $6
- Local resistance: $7.50
If the price holds above $6, we could see it going toward $11.50–$12 range.
