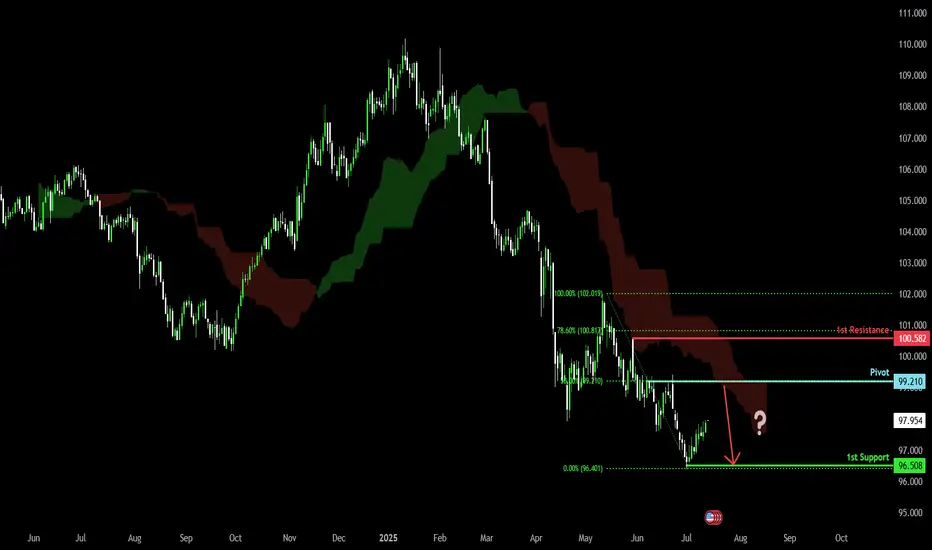
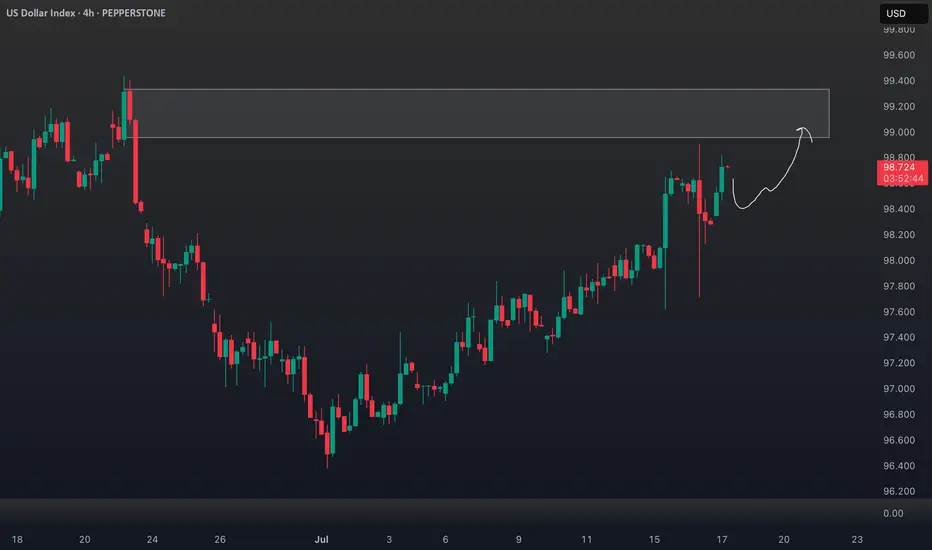
Bearish continuation?US Dollar Index (DXY) is risng towards the pivot which is a pullback resistance and could drop to the 1st support.
Pivot: 99.21
1st Support: 96.50
1st Resistance: 100.58
Risk Warning:
Trading Forex and CFDs carries a high level of risk to your capital and you should only trade with money you can afford to lose. Trading Forex and CFDs may not be suitable for all investors, so please ensure that you fully understand the risks involved and seek independent advice if necessary.
Disclaimer:
The above opinions given constitute general market commentary, and do not constitute the opinion or advice of IC Markets or any form of personal or investment advice.
Any opinions, news, research, analyses, prices, other information, or links to third-party sites contained on this website are provided on an "as-is" basis, are intended only to be informative, is not an advice nor a recommendation, nor research, or a record of our trading prices, or an offer of, or solicitation for a transaction in any financial instrument and thus should not be treated as such. The information provided does not involve any specific investment objectives, financial situation and needs of any specific person who may receive it. Please be aware, that past performance is not a reliable indicator of future performance and/or results. Past Performance or Forward-looking scenarios based upon the reasonable beliefs of the third-party provider are not a guarantee of future performance. Actual results may differ materially from those anticipated in forward-looking or past performance statements. IC Markets makes no representation or warranty and assumes no liability as to the accuracy or completeness of the information provided, nor any loss arising from any investment based on a recommendation, forecast or any information supplied by any third-party.
DXY trade ideas
USD Falling Wedge Breakout - Bulls Continue to Turn the TideThe USD showed oversold conditions via RSI on both the daily and weekly chart as we began Q3. But, so far, the new quarter has shown a change-of-pace, as the currency has continued to rally with another topside breakout today around CPI data.
The breakout today happened at a big spot - as the long-term fibonacci level at 97.93 had previously helped to hold support back in April, leading to the bounce that ran into May. More recently that price had come in as resistance, until this morning's breakout. And it was in the immediate aftermath of the CPI release that buyers came in to hold the low at that exact level five minutes after the data dropped, and that led to a strong breakout in the USD as bulls took over.
The move is still fresh, however, as we haven't yet seen 23.6% of the sell-off from H1 get clawed back. The retracement from that move plots at 99.63, with the 100.00 level sitting overhead. Below that price, the 99.39 level remains notable as this was a June swing high, and now functions as a follow-through resistance level.
Bigger picture, it's the 101.65-102.00 zone that bulls will need to show up at to make this into anything more than a corrective pullback in a broader bearish trend. - js
Dollar Major BottomDollar has just finished a major zigzag correction. I was correct, in my last idea, of calling one more leg lower before this major low. Watch for the dollar to PUMP in 5 waves!

DXY LONG SETUP | Skyrocketinggggg
This is a bullish setup on the U.S. Dollar Index (DXY), taken from the 1H timeframe using Smart Money Concepts.
Price retraced into a clearly defined 1H demand zone where it also tapped a trendline support, creating a strong confluence +an LQC. The zone had internal liquidity swept and price mitigated a bullish order block, indicating potential institutional re-accumulation.
Entry was taken after bullish confirmation within the zone (engulfing candle), aligned with my SMC strategy which targets liquidity grabs and mitigation zones.
🔹 Entry: 98.06
🔹 SL: 97.83 (below the zone and structure)
🔹 TP: 99.11 (previous H1 high & clean supply zone)
🔹 RR: Approx. 4.5R
🔍 Technical Confluences:
Demand zone + OB mitigation + LQC
Trendline reaction (support respected)
Liquidity sweep + BOS (Break of Structure)
Clean imbalance above = fuel for price
Bullish engulfing as confirmation
📰 Fundamental Bias:
Today’s U.S. Jobless Claims came in better than expected, signaling labor market strength. Additionally, Retail Sales data was positive, reinforcing USD strength. These support a hawkish Fed narrative, aligning with our bullish technical setup.
Bias remains bullish unless price closes below 97.83 (invalidation level).

Sometimes, it can be this easy. DXY BULLISH continuationAs I'm trying to give reason, the market is running away.
I've guided you from the low till now, stop doubting my analysis please.
This is a discount price, DXY is still bullish till 99.42. Dont be caught on the sideline. EURUSD and other pairs are bearish. Trade accordingly
Follow me as my trades are market orders, so you will see them on time and enter the trade on time
Enjoy

Dollar looks ready to blast off...we'll see if its a risk assetBasic, strength and pattern analysis. Dollar appears to be completing its Primary A wave of a cyclical correction. Strength has built up, the pattern looks right, and leave it to a large magnitude A wave to complete in a no man's land of Fib support...(ABC extension corrective not pictured).
I would expect a run back up to the Intermediate B over the next 6-8 months, and maybe even higher. One more low is possible, but not necessary...neither from a pattern perspective, nor from a strength perspective, although I have a little extension box below in green, and if it is to extend, that is the target.

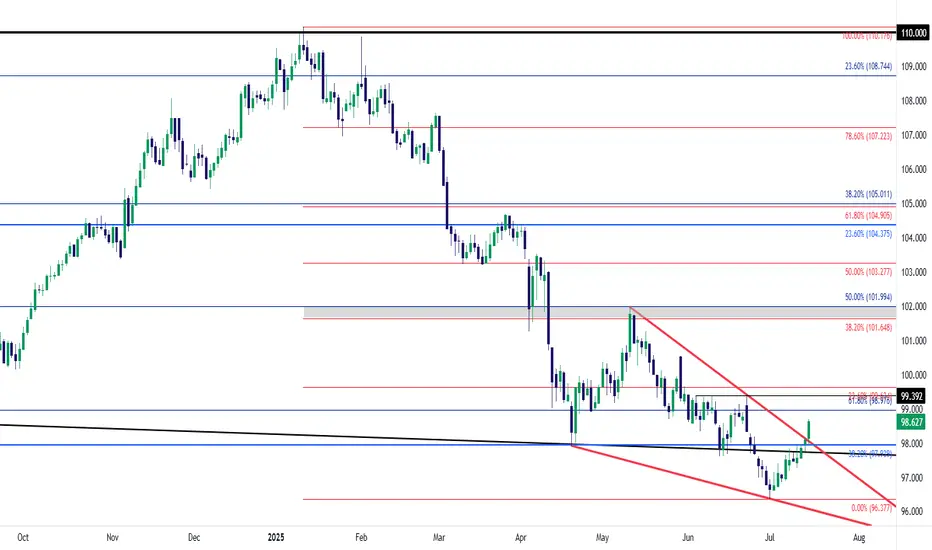
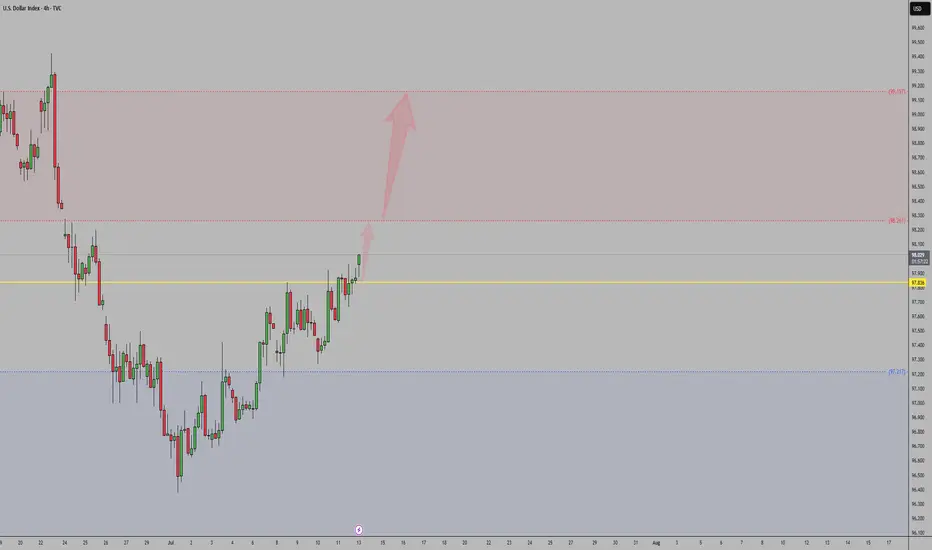
Weekly DXY OutlookWeekly DXY Outlook - Updated
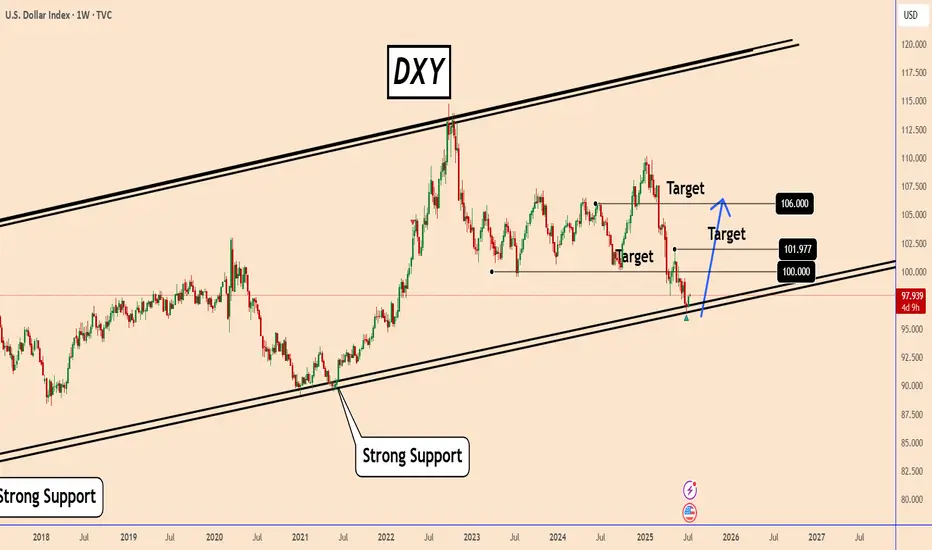
DXY is still bullish and is rising slowly
On the weekly chart, the US Dollar Index (DXY) has reached a critical zone that was last tested in February 2022.
While a rebound is not guaranteed, the fact that the DXY has declined nearly 12% over just six months—despite a resilient U.S. economy—suggests the potential for renewed strength in the dollar.
I think the index could begin a recovery toward key levels at 100.00, 101.97, and possibly 106.00/
It’s worth noting that the broader bearish trend began with the trade tensions initiated during the Trump administration, which strained relations with several major trading partners.
Given that this is a weekly chart, it should be used more as a reference point rather than a trading signal.
You may find more details in the chart!
Thank you and Good Luck!
Three trade setup to the upside.Three trade setup to the upside.
1. Daytrade
2. Short term swing
3. Swing Trade
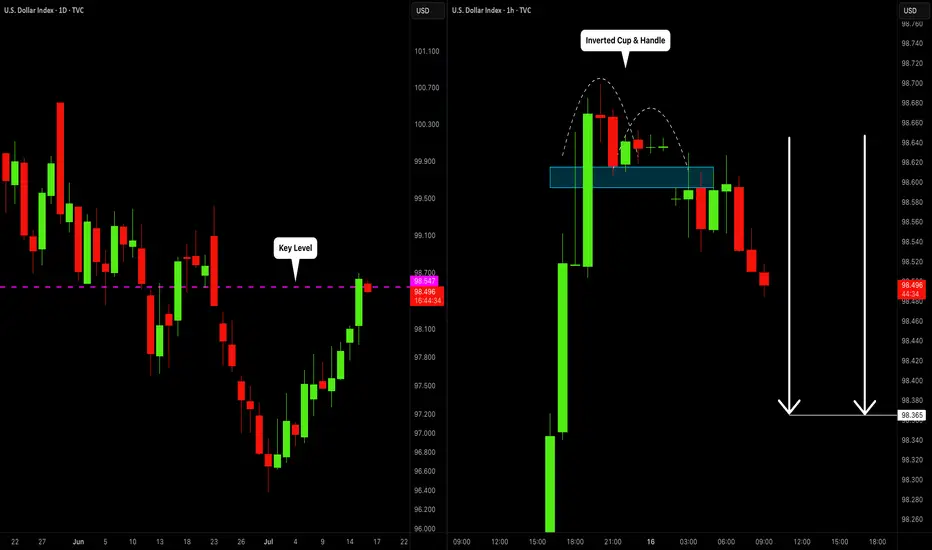
DOLLAR INDEX (DXY): Bearish Move From Key Level
I think that Dollar Index may drop from a key daily horizontal resistance level.
As a confirmation, I spotted an inverted cup & handle pattern on an hourly time frame
and a bearish violation of its neckline.
The market will most likely continue falling at least to 98.36
❤️Please, support my work with like, thank you!❤️
Dollar Index Having Bullish MomentumDollar Index shown good bullish momentum on previous day as we analyzed it earlier. Index has created a imbalance now the possibility for the index is to retrace back to imbalance and continue the bullish momentum and target towards the supply zone and swing high.

DXY: potentially aiming for January 2025 highsAlthough we do not Trade the dollar specifically, it is a good barometer the feel out other assets.
It seems like DXY reached a MONTHLY LEVEL. I expect price to form a FVG within this rectangle on the daily level. Which will eventually create a GAP on one of the currencies. Will follow up when this happens.
IMO reversed and is going to reach the daily level quick. This will mean, POUND, EURO DOWN.

DXY Trade Bias | Bullish Continuation Structure🔍 Chart Breakdown:
Trendline support respected
Order flow blocks (OBs) unbroken — confirming demand
Minor liquidity grabs without breaking bullish structure
Double mitigation of intraday OB, implying potential bullish continuation

DXY Short Very Soon going to $96 or lowerCorruption has broken out all over America. Nothing good can come of this.
Wait for a solid Red weekly bar on DXY and short until 96 or lower.
- Earthquakes
- Wildfires over 600
- Floods
- Riots
- Epstein Files
- Housing (Only for the rich)
- Rental Increases
- Home Insurance Price increases
- Fraud for the Elite (Multiple Coins Created with withdrawals outside of US involving other Presidents)
- Crypto Investigations on Politicians
- Children Migrants being deported (Age 6 with Cancer)
TVC:DXY
FX_IDC:CADUSD
ECONOMICS:USTR
FRED:TREASURY
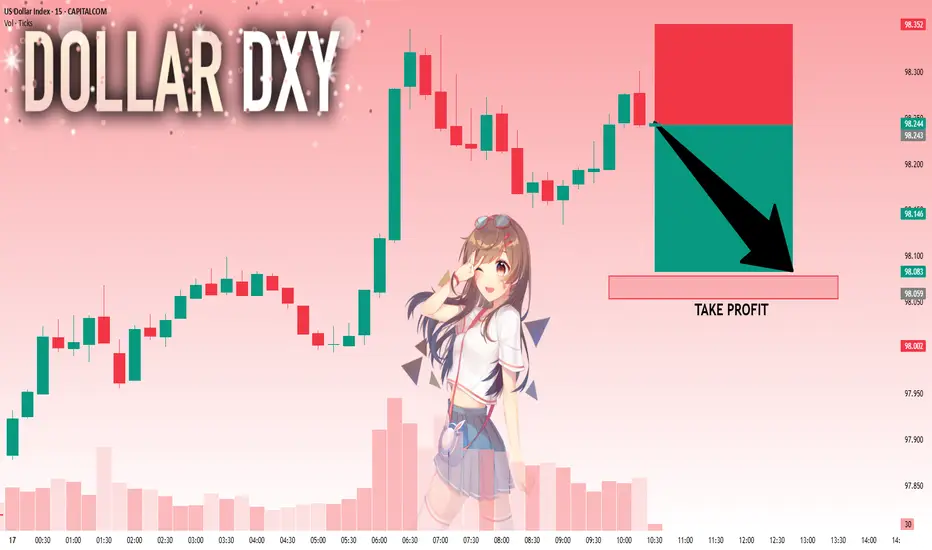
DXY: Next Move Is Down! Short!
My dear friends,
Today we will analyse DXY together☺️
The price is near a wide key level
and the pair is approaching a significant decision level of 98.243 Therefore, a strong bearish reaction here could determine the next move down.We will watch for a confirmation candle, and then target the next key level of 98.078..Recommend Stop-loss is beyond the current level.
❤️Sending you lots of Love and Hugs❤️
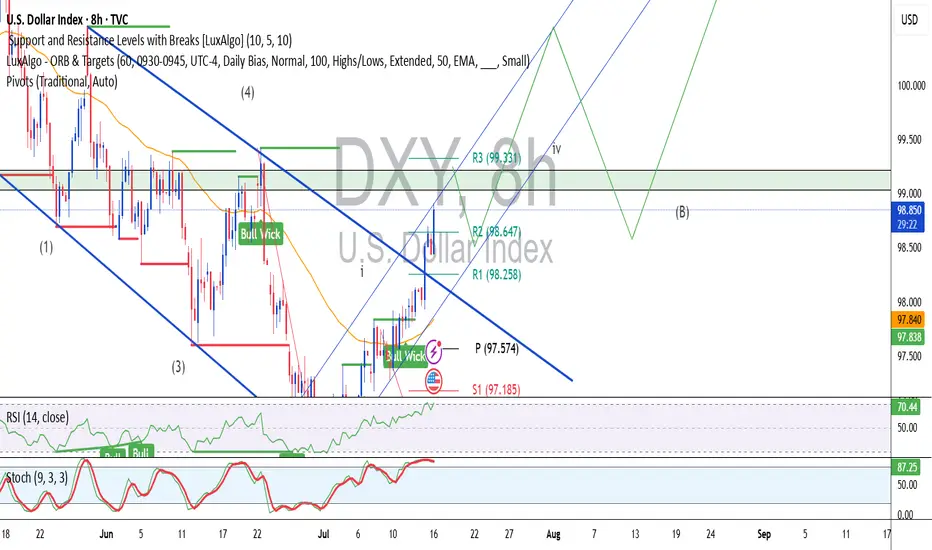
DXY Outlook: Bullish Move Fueled by Fundamentals & GeopoliticsTechnical Analysis (4H Chart & Broader Context) 📈🕓
The DXY 4H chart shows a clear bullish trend 🚀, with higher highs and higher lows since early July. DXY has caught a strong bid, breaking above short-term resistance near 98.40 and now eyeing the previous swing high 🎯. This matches the consensus among analysts: DXY remains in a bullish structure, with momentum supported by both technicals and macro factors.
Key resistance: Next upside target is the previous high (around 99.60 on the chart), with further resistance at the psychological 100 level 🏁.
Support: Immediate support at 98.20, then 97.60 🛡️.
Momentum: Strong bullish candles and no major bearish reversal signals on the 4H. Some analysts note positioning is stretched, so a short-term pullback or consolidation is possible before more upside (IG).
Fundamental Analysis 💹🌍
Why is DXY rallying?
Fed Policy & US Data: The US economy is resilient 💪, with robust services data, strong retail sales, and a recent uptick in core inflation. The Fed is less dovish, with markets now expecting a slower pace of rate cuts 🏦.
Interest Rate Differentials: The US keeps a yield advantage as the Fed is less aggressive in cutting rates compared to the ECB and BoJ, especially with Europe and Japan facing weaker growth and possible further easing 🌐.
Geopolitical Factors: Ongoing trade tensions (Trump’s tariff threats) and global uncertainty (including Middle East risks) are driving safe-haven flows into the dollar 🛡️🌏. DXY typically strengthens during periods of geopolitical stress.
Positioning: CFTC data shows USD long positioning at multi-month highs, which could mean the market is crowded and vulnerable to short-term corrections ⚠️ (IG).
Trade Idea (Bullish Bias, Targeting Previous High) 💡💵
Setup:
Bias: Bullish, in line with the prevailing trend and macro backdrop 🟢.
Entry: Consider buying on a minor pullback to the 98.20–98.40 support zone, or on a confirmed breakout above the recent high 🛒.
Target: Previous swing high near 99.60, with a stretch target at 100.00 🎯.
Stop: Below 97.60 (recent swing low/support) ⛔.
Risk Factors:
Overbought positioning could trigger a short-term pullback ⚠️.
Any dovish surprise from the Fed or rapid de-escalation in global tensions could cap further gains 🕊️.
In summary: The DXY’s bullish trend is underpinned by resilient US data, a hawkish Fed, and global risk aversion. Your bullish bias is well-supported, with the previous high as a logical target. Watch for short-term pullbacks, but the broader trend remains up unless key support is lost. 🚦
DXYNet USD longs increased = Bullish sentiment
Speculators adding longs / commercials reducing shorts
Price broke previous weekly high = BOS
✅ Holding weekly demand zone
Note: COT is supportive — align with technicals
Sometimes, it is this simple. DXY BULLISH I'm selling EURUSD and other pairs. DXY is still bullish till 99.42. Once price reach there, we will recheck and let price tip its hand.
This is discount price, dont miss out
Follow me as my trades are market order, so you will see it on time and enter on time

DXY Bullish Pennant (awaiting breakout)**1-hour timeframe** of the **US Dollar Index (DXY)** with technical analysis applied. Here's the breakdown:
**Technical Analysis Summary:**
**Current Price:**
* Around **98.08**, trading just under the **7 EMA (98.09)**.
**Bullish Structure:**
* A strong **bullish impulse leg** is visible (sharp green candle rally).
* Followed by a **bullish flag/pennant** pattern (marked in red), which is typically a **continuation pattern** in an uptrend.
* The flag is forming after a steep upward move — suggesting **consolidation before potential breakout continuation**.
**EMA Trend Support:**
* **EMA 7, 21, and 50** are aligned bullishly:
* EMA 7 > EMA 21 > EMA 50
* This supports the **short-term uptrend** structure.
**Support Zones:**
* A strong **demand zone** is marked between **97.50–97.70** (highlighted in red), where price previously consolidated before the breakout.
* EMA 50 also sits around **97.72**, reinforcing this as a strong **pullback support level**.
**Possible Scenarios:**
1. **Bullish Continuation:**
* If the price breaks above the flag resistance, it may **rally towards 98.70 → 99.00 → 99.10**.
2. **Bullish Pullback:**
* If price dips to retest the support near **97.80–97.90** or EMA 21, and holds, it may bounce and continue upward.
**Conclusion:**
* **Trend:** Bullish
* **Pattern:** Bullish Pennant (awaiting breakout)
* **Support:** 97.72–97.90
* **Upside Targets:** 98.70 → 99.00+
* **Outlook:** Positive bias continues **as long as price holds above the support zone** and EMAs.

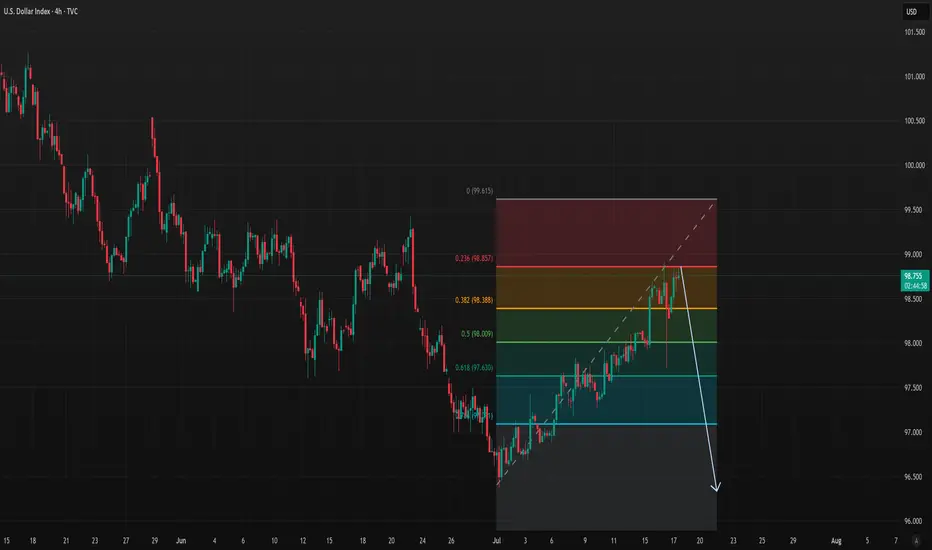
possibility bof uptrendIt is expected that some fluctuation and correction will form within the current resistance zone, then there is a possibility of a trend change and the start of a downtrend.
As long as the index does not stabilize above the green resistance zone, a downtrend is likely.

DOLLAR INDEX U.S. Economic Data Release on the July 15th
Key Inflation Indicators
Indicator Current Forecast Previous
Core CPI m/m
0.2% 0.3% 0.1%
CPI m/m
0.3% 0.3% 0.1%
CPI y/y
2.7% 2.6% 2.4%
Core CPI m/m came in slightly below forecast, but still accelerated from the previous month, indicating underlying inflation pressures remain present.
Headline CPI m/m matched expectations, showing persistent monthly price growth.
Annual CPI (y/y) registered above forecast, indicating inflation is running hotter than previously expected and at its highest level since early 2025.
Empire State Manufacturing Index
Indicator Current Previous
Empire State Manufacturing Index 5.5 -8.3
The sharp rebound from negative territory signals a marked improvement in manufacturing sentiment in the New York region, pointing to possible resilience in U.S. industrial activity.
Market Implications
US Dollar (USD):
Inflation coming in at or above forecast (annual and headline monthly), along with better-than-expected manufacturing data, has support the USD in the short term. Stronger inflation weakens the case for near-term Federal Reserve rate cuts.
Treasury Yields:
Yields edged higher as bond traders weigh persistent inflation against a resilient economy, with less urgency for monetary easing.
Equity Markets:
Slightly hotter inflation and improved factory activity brings mixed reactions. Investors could become cautious over reduced chances of Fed rate cuts, but healthy manufacturing data may fuel selective equity support.
Commodities:
Gold and other non-yielding assets faced modest headwinds from a stronger USD and rising yields.
In summary:
U.S. inflation data for June shows headline and annual CPI above forecast, and core inflation still rising, suggesting persistent price pressures. The Empire State Manufacturing Index rebounded sharply, signaling improved business sentiment. These surprises likely reinforce expectations for a cautious Federal Reserve, with possible USD gains and ripple effects across equity, bond, and commodity markets.
#DXY #DOLLAR

Dollar MoonHey,
Been a while that I shared a chart here, sorry for that.
I love the place where the dollar is at the moment.
The easiest plays are from these long-term value areas, and this one is also stacked with a trendline making it a bit more obvious for everyone.
The daily trend is broken since yesterday, shifting bullish long-term. I think a daily pullback is likely, perhaps even back to daily lows to fill up demand.
But long-term, I am super bullish for the dollar.
The $ has been bullish since 2008, we all see it.
Time for the next leg up.
Let's go!
Kind regards,
@ mnieveld

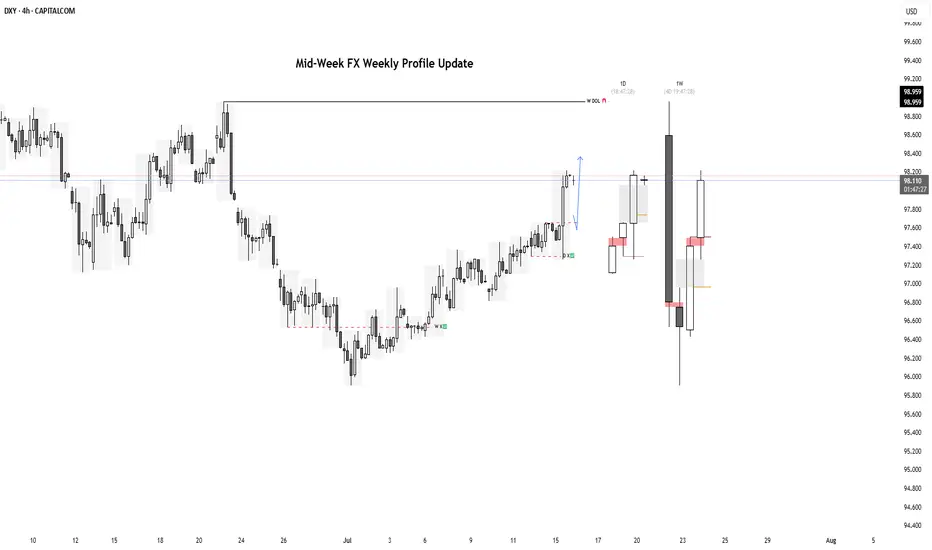
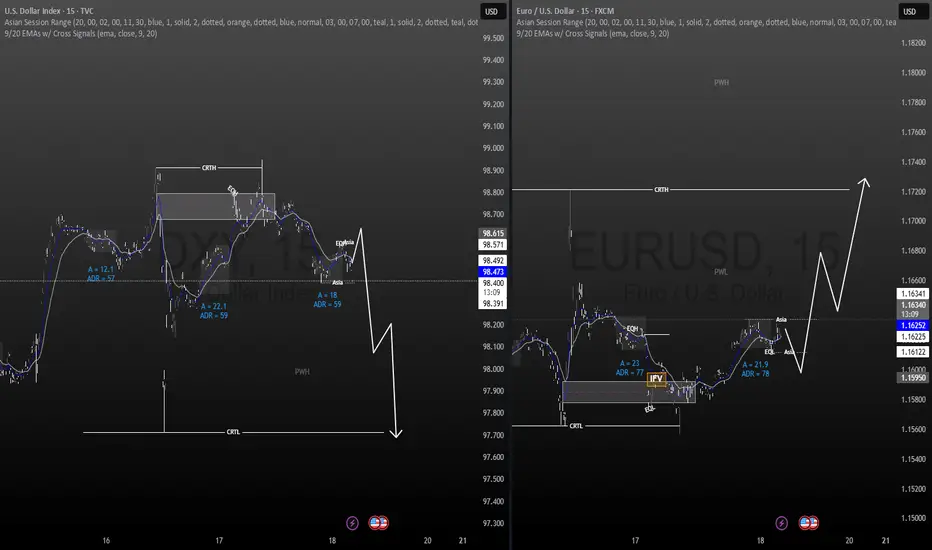
Mid-Week FX Profile UpdatesMid-Week FX Profile Update with Daily and Weekly Overlays
USDJPY
EURUSD
GBPUSD
GOLD