US100 Index – Potential Bearish Reversal in Key Resistance Zone🧠 US100 Index – Potential Bearish Reversal in Key Resistance Zone
Timeframe: 30-Minute | Chart Published: July 24, 2025
---
🔍 Overview
The US100 (NASDAQ) has been trading in a well-structured ascending channel, forming higher highs and higher lows. However, recent price action suggests that the index is testing a critical supply zone near 23,400, with signs of weakening bullish momentum. This may signal a potential corrective phase or bearish reversal.
---
📈 Technical Analysis Breakdown
🔵 Trend Structure:
Price is respecting a clear ascending trendline (blue), connecting multiple higher lows.
Multiple bullish flag/channel formations have been completed within the uptrend, showing healthy momentum until the current point.
🟥 Resistance Zone:
Strong supply zone marked between 23,250 – 23,450.
Price action shows stalling candles and rejection wicks within this zone, indicating buyer exhaustion.
⚠ Bearish Patterns:
The red path projection suggests a head and shoulders-like structure forming at the top of the channel.
This, along with divergence in wave strength and shrinking momentum, supports a potential reversal.
🔵 Key Support:
First support lies around 23,000 — aligning with the ascending trendline and previous consolidation.
If broken, next demand zone is around 22,835 – 22,900, where historical consolidation took place.
---
🔁 Projected Scenario (as per visual path)
1. Price may attempt one last push into the 23,400–23,450 zone (possible false breakout).
2. Rejection from this level could trigger a fall toward the ascending trendline support.
3. A confirmed break of the trendline can lead to a larger correction toward the 22,800 zone.
---
🧠 Unique Insight
This chart combines multi-timeframe structure recognition with a real-time reversal formation inside a long-standing bullish trend. The analysis doesn’t just rely on textbook patterns—it recognizes real-time price behavior shifts, which makes it valuable for proactive traders.
---
📌 Conclusion
While the trend remains bullish overall, caution is warranted as the US100 approaches a historically significant resistance zone. The setup offers a compelling risk-reward short opportunity for aggressive traders, especially if the price confirms a break below trendline support.
---
🔧 Next Steps for Viewers
> “Watch for a clean rejection candle or lower high at resistance before entering short. If trendline breaks cleanly, 22,835 could be the next target zone.”
USTEC trade ideas

NAS - TIME FOR JUICYTeam, hope you all making a killing on SHORT tonight.
as we expected. Thank you for asking and be patience
TIME TO MAKE NAS100 GREAT AGAIN.
Sorry my entry was 23240, but now the market is 23332
you should entry small volume at the current price 23332 - if a little pull back below 23300 add more
STOP LOSS at 23230-50
TARGET 1 at 23385-23400
TARGET 2 at 23475-23515
LETS go - time to make ACTIVE TRADER ROOM GREAT AGAIN.!

NAS - LET'S MAKE MILLIONS Team, last night NAS I was expect the FALL BACK as I predicted rate un-change will get NASTY on both DOW AND NAS.
So I have a set up entry LONG, i didnt expect the NAS flying to the moon.
both target hit so fast in 15 minutes
However, today is another opportunity to SHORT NAS on the current market at 23613-23625
STOP LOSS AT 23720
Once the NAS pull back toward 23580-65 - BRING STOP LOSS TO BE
TARGET 1: at 23540-20
TARGET 2: at 23480-65
LETS GO

NASDAQ-Lets catch 250 Points togetherHello Fellow Traders,
Nasdaq has been wild since a time now. Today, I have spotted a rade to share with my fellow traders.
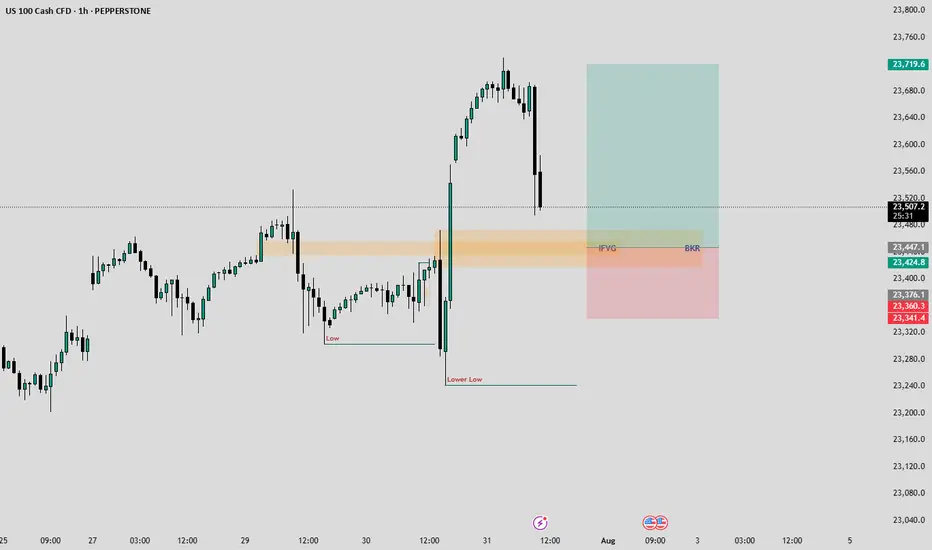
Yesterday closed with a good bullish candle. As the NY seesion has begun now, I am anticipating price to retrace to the highlighted breaker block that accurately aligns with an IFVG as well.
I am waiting for the price to fall into my area where I will monitor price's reaction, if we see signs of ejection from the highlighted areas, I wuld love to take a Buy Trade.
Entry= If rice enters the Breaker and IFVG and shows a good rejection.
SL= 23340
TP= Today's highs or 23700.
Manage your risk according toyour capital and only enter the trade if we happen to see a good rejection from the area. Be patient and don't hurry.
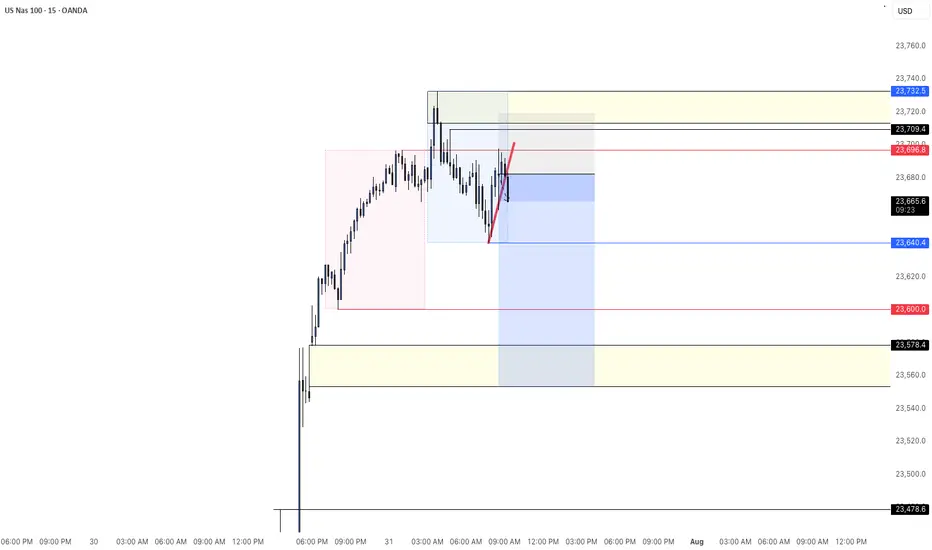
NAS100 - SHORTPrice hit TP after yesterday's long position. Created new all time highs into the asian/London session. We have a nice gap I will target as my potential full TP.
USNAS100 New ATH, looks a Correction...Wall Street Indices Hit Record Highs as AI Momentum Builds
Indices tied to the S&P 500 and Nasdaq reached fresh all-time highs on Thursday, driven by strong earnings reports from Meta and Microsoft. The results reinforced investor optimism that AI investments are delivering tangible returns and fueling future growth.
Meanwhile, Fed Chair Jerome Powell noted it's still too early to predict a rate cut in September, emphasizing that current monetary policy is not constraining economic activity. His comments followed a stronger-than-expected Q2 GDP reading, further supporting the Fed’s cautious stance.
Technical Outlook – USNAS100
After reaching recent highs, the index appears to be entering a corrective phase. A pullback toward 23470 is likely, with bullish momentum expected to resume if the price stabilizes above 23440. A sustained move above that level would target a new ATH near 23870.
However, a break below 23440 could trigger a deeper correction toward 23295.
Support: 23540 • 23440 • 23295
Resistance: 23870 • 24040

CASH100 (NASDAQ) CRASH - Head and shoulders Risk/reward = 3.7
Entry price = 23 430
Stop loss price = 23 503.2
Take profit level 1 (50%) = 23 202
Take profit level 2 (50%) = 23 099
Still waiting for some variables to confirm before entering the trade
USNAS100 Correction in Play – Watching 23390 & 23440USNAS100
The price is undergoing a bearish correction while trading below 23440, with downside targets at 23300 and 23295, especially if a 1H candle closes below 23390.
A bullish scenario will be activated if price closes 1H above 23440, opening the path toward 23530 and potentially 23700.
At the moment, the market appears to be correcting toward 23295 before attempting a bullish rebound.
Support Levels: 23300 – 23210 – 23150
Resistance Levels: 23530 – 23700

US100 A Waiting Reject from resistanceThe market is currently watching for a rejection from the top resistance zone. Sentiment improved after the US and China extended their tariff truce until November 10, avoiding triple-digit duties on each other’s goods.
2.8% or higher reading likely supports a bearish move toward 23,250 and then 23,950mBelow 2.8% reading → could fuel bullish momentum toward a new ATH at 23,900.
You may find more details in the chart.
Trade wisely best of Luck Buddies.
Ps; Support wit like and comments for better analysis Thanks.
Dip-buying on the Nasdaq?The Stock market rallied following the July US CPI inflation data, with the Nasdaq 100 climbing to an all-time high of 23,849. Overlooking the economic picture for now, price action has exhibited a clear uptrend since early April this year. This is evident from the price, which has chalked up a series of higher highs and higher lows, trading above the 200-day simple moving average at 21,100, and with the dynamic value pointing higher.
Traders seldom attempt to buy at record highs; they tend to buy into retracements from support levels. Therefore, support levels of note right now include 23,347 (1W), 22,990 (1W), and 22,592 (1M).
Written by the FP Markets Research Team

NASDAQ 100| Bullish OutlookHTF (4H)
Price has broken major external structure highs, currently trading near the 23,712 zone with strong bullish momentum. My focus is on buying opportunities after a clean pullback — ideally sweeping sell-side liquidity into the 4H OB. Price action is being monitored closely for confirmation.
LTF (30M/5M)
Structure remains clean and respected. I’m watching for a liquidity sweep into the 23,444 – 23,399 OB zone.
Execution Plan
Targeting 5M highs for intraday delivery or 30M highs if momentum extends. Trade will be managed in alignment with internal framework structure and market delivery behavior.

Rate-cut optimism fueled risk-on mood, lifting US equities
July CPI showed little inflationary impact from tariffs, amplifying expectations for a September Fed cut. Optimism also returned for small-cap firms, previously seen as most vulnerable to tariff pressures. Headline CPI rose 2.7% YoY in July, 0.1% lower than a year earlier, with a 1.1% MoM drop in energy prices contributing to the overall decline.
BlackRock CIO Rick Rieder noted that shelter costs, the largest CPI component, slowed to their lowest since 2021, significantly boosting the odds of a September cut. He added that the Fed could take a more aggressive approach, with a 50bp cut at the September FOMC.
USTEC extended its sharp uptrend after breaching above the 23700 high. The widening gap between both EMAs indicates the potential continuation of bullish momentum. If USTEC holds above 23700, the index may gain upward momentum toward the psychological resistance at 24000. Conversely, if USTEC breaks below 23700, the index could retreat toward 23300.

Nasdaq Short Again (nth time): Fibo Extension Level and 5-wavesOver here, I attempt to short Nasdaq again after another failure yesterday. This time, the 5-waves structure is supported by Fibonacci Extension level at 2.618x sub-wave 1 against entire wave 5 structure.
However, take note the circled area where I pointed out 2 imperfections in the wave structure:
1. Wave 4 overlaps Wave 1
2. Sub-wave 4 overlaps Sub-wave 1 (a comparison with S&P500 increases the odds that it may still be a valid count)
Given the imperfections of the wave counts, we still need to set our stop above the all-time-high to protect ourselves.
Good luck!

NasdaqNasdaq is showing bearish signals based on COT data with large traders adding shorts. Price is currently at a confirmed supply zone, increasing the likelihood of a downward reversal.

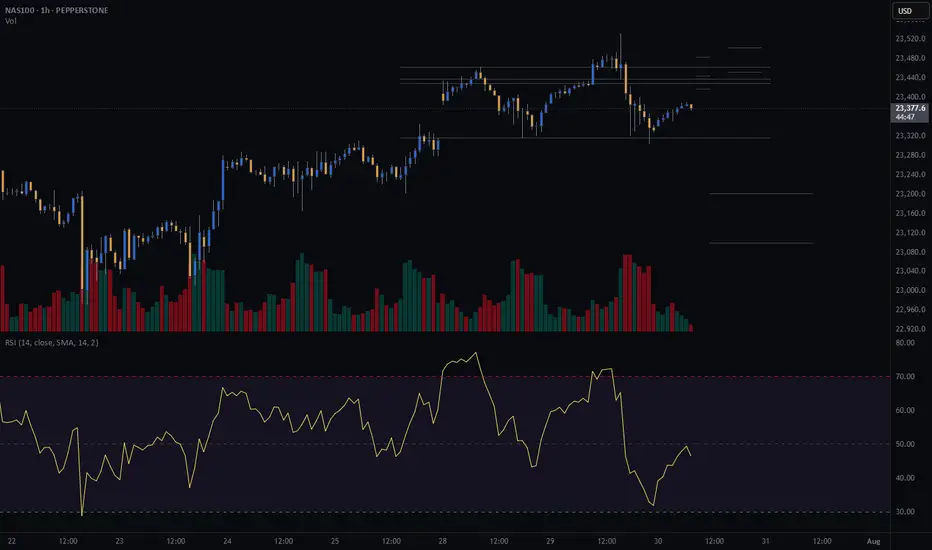
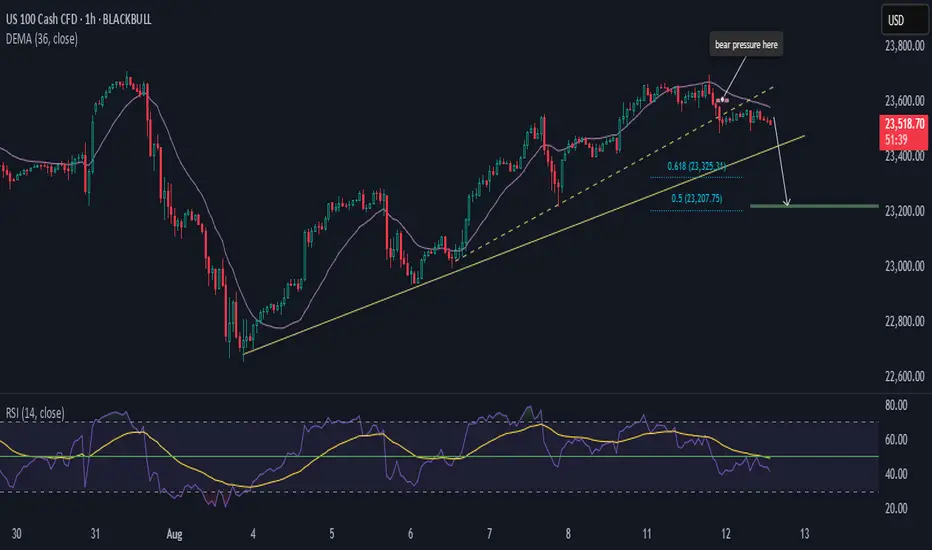
NAS100 Building Up On Bearish PressureHi there,
NAS100 has been very surprising for us recently, with increased bullishness that appears to be giving a bearish bias.
🦉 We'll use RSI and DEMA to coordinate price movements.
🎙️The price is bearish from the 23,600 area and has broken a minor dashed trendline. As long as the price remains below the purple 36 DEMA, below the RSI 50 level, and below the yellow RSI EMA, we remain bearish toward the solid trendline. This outlook points to two target support areas: 23,325 and 23,207.
🧩 Note: the bearish momentum is driven by the 3-hour chart. If it changes there, the setup will be invalidated.
Happy Trading,
K.
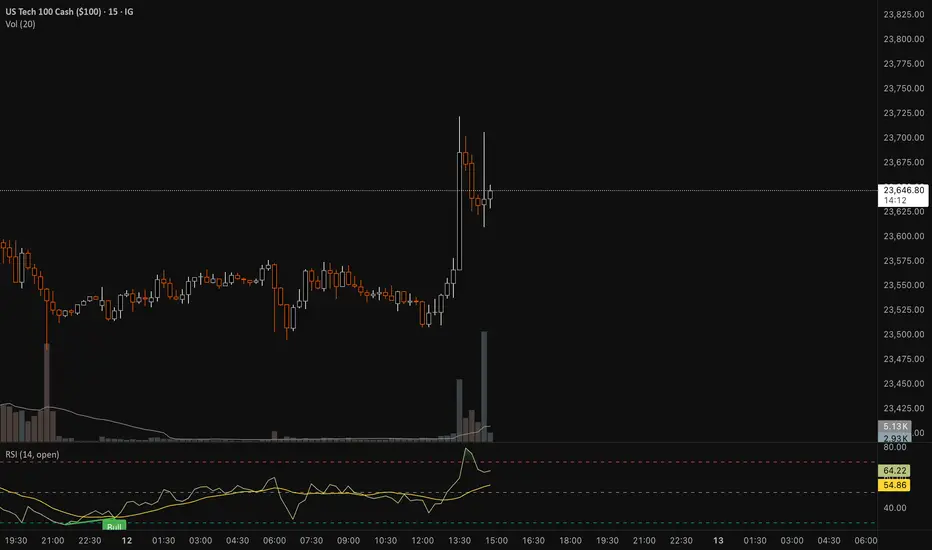
NAS100 Sell Trade PlanThe market is showing a lower high formation on the 1H chart, indicating potential bearish continuation. Entry is planned at 23,481.2, with a stop loss at 23,584.6 to protect against upside breakouts. The first target (TP1) is set at 23,363.8 to secure partial profits, and the second target (TP2) is at 23,275.0 for extended downside potential. RSI is currently below the 50 level (44.70), supporting bearish momentum. Risk-to-reward ratio favors the setup, aligning with the recent downtrend structure.

NAS100 at mjaor resistance area Fib 0.5Price has reached the 0.5–0.382 Fibonacci retracement zone of the recent swing. If the bears are strong, we may see a rejection toward the trendline support. However, if this resistance is broken, a bullish continuation is also possible. Let's see how it plays out.

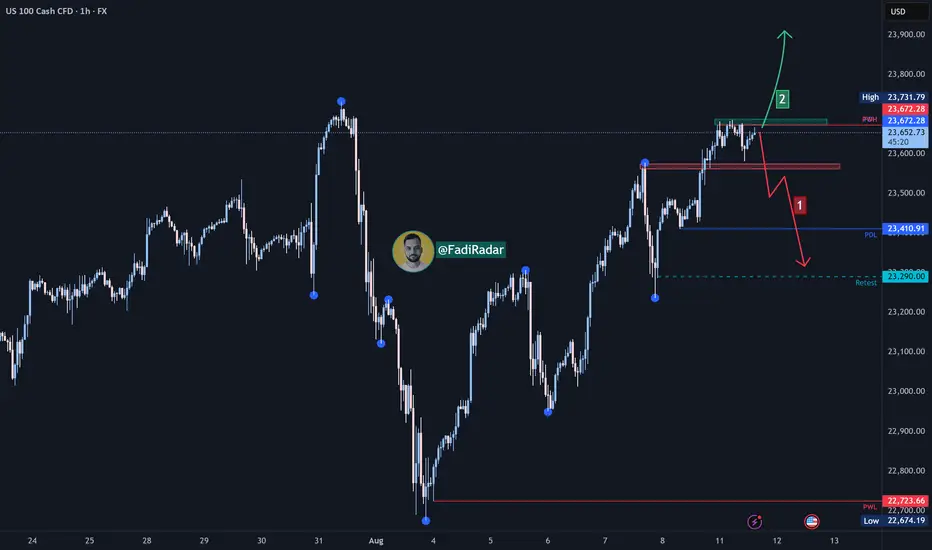
Nasdaq Index Analysis (US100 / NASDAQ)The index is currently trading near $23,670, a pivotal zone between two possible scenarios:
🔻 Bearish Scenario:
If the support at $23,570 is broken and the price holds below it, we may see a decline first toward $23,400, followed by an extended move toward $23,290 as a test area. A break below this level could open the door for further downside corrections.
🔺 Bullish Scenario:
If the price successfully breaks and holds above $23,680, this could support a continuation of the uptrend toward $23,800, and with sustained momentum, a new high could be targeted.
⚠️ Disclaimer:
This analysis is not financial advice. Please monitor market behavior and analyze data carefully before making any investment decisions.
US100 Bullish Momentum Targets AheadThe US100 shows strong bullish structure after completing an ABCD correction, with price eyeing a potential move towards the 1st target at 23,791 and possibly the 2nd target at 24,053. A brief pullback may precede the continuation towards these key resistance levels.
1. Current Structure
The chart follows an ABCD pattern after a strong bullish impulse from the early August lows.
Points A–B–C–D suggest a completed correction phase, with momentum now shifting upward.
Price is currently around 23,629, approaching the first resistance zone.
2. Key Levels
Immediate Support: ~23,500 (recent swing low, short-term demand zone)
1st Target: 23,791 (minor resistance, potential profit-taking zone)
2nd Target: 24,053 (major resistance, psychological round area)
Major Support: 23,200 (break below here could invalidate bullish momentum)
3. Price Action Expectation
Short term:
A small pullback toward 23,500–23,550 is possible before continuing upward (healthy retracement to build buying pressure).

NAS100 Trend following tradeNas100 has been on a bullish run and already had a trade running which is already trailing. looking to add a new position after that engulfing on 1hour candle.

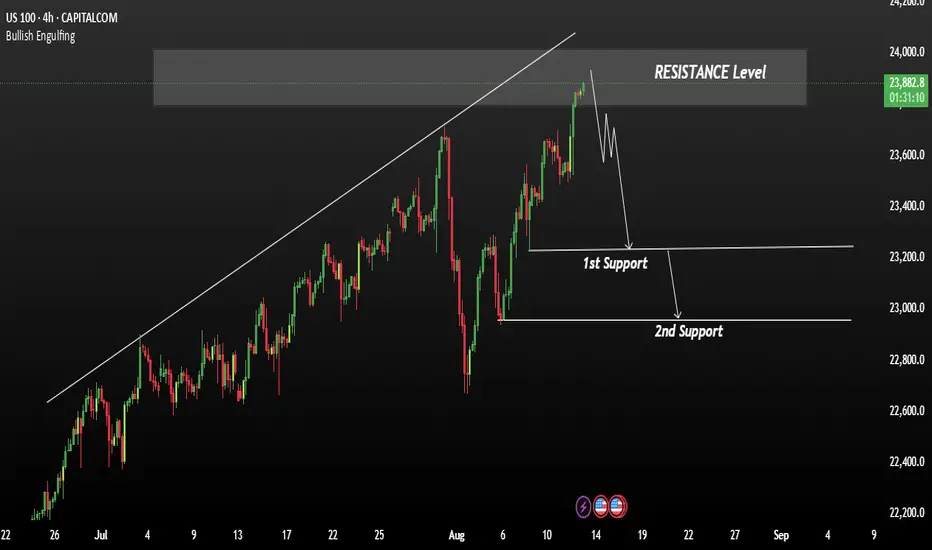
NAS100 - Stock market awaits an important week!The index is above the EMA200 and EMA50 on the four-hour timeframe and is trading in its ascending channel. If the index corrects downwards towards the drawn trend line or the specified demand zone, you can buy Nasdaq with better reward for risk.
Many Federal Reserve officials believe that tariffs could weaken the U.S. economy and push inflation higher—a dilemma that forces policymakers to choose between cutting interest rates to support growth or keeping them unchanged to control prices.
However, Miran—the economic adviser President Donald Trump intends to nominate to the Fed’s Board of Governors—rejects this view. He argues that tariffs will ultimately benefit the economy and will not significantly impact prices, allowing the Fed to resume the rate-cutting cycle it halted earlier this year.
The key question now is whether Miran’s arguments will be persuasive enough to sway the broader thinking of the central bank’s policy committee, or whether concerns over labor market weakness might prompt rate cuts regardless, rendering his arguments unnecessary.
According to analysis from The Wall Street Journal, beyond the policy disagreements, Miran has also challenged the institutional legitimacy of the Federal Reserve. He has accused Fed officials of having political motivations and criticized them for what he calls the “tariff disruption syndrome.” In a paper published last year, he argued that all senior Fed officials should be subject to dismissal at the White House’s discretion. If appointed, he would give Trump a loyal ally inside the Fed’s boardroom—someone capable of promoting the president’s views and challenging the institution’s consensus-driven culture and influential research staff.
Meanwhile, JPMorgan has revised its monetary policy forecast for 2025, now expecting the Fed to deliver three 25-basis-point rate cuts starting in September 2025, compared to its earlier projection of just one cut in December.
Miran, who holds a Ph.D. in economics from Harvard University, currently serves as Chairman of the White House Council of Economic Advisers. On Thursday, Trump announced his intention to nominate him for a newly vacant Fed board seat. This position became available unexpectedly after Adriana Kugler’s resignation last week and will expire in January. Trump also revealed plans to nominate another individual to fill this seat, who could potentially replace Jerome Powell as Fed Chair in the spring. Miran’s appointment would give Trump additional time to evaluate how candidates—whether Miran himself or Christopher Waller, whom he appointed during his first term—align with his policy views and vote on interest rates.
This week’s economic calendar is once again crowded, with a series of key inflation reports and consumer-related indicators in the spotlight.
Early Tuesday, the Reserve Bank of Australia will announce its interest rate decision, with markets expecting a 25-basis-point cut from 3.85% to 3.60%. Shortly after, traders’ attention will shift to the U.S. Consumer Price Index (CPI) for July, where core inflation is expected to rise from 0.2% in June to 0.3%.
Wednesday will be relatively quiet, with the main highlight being speeches from Fed officials Austan Goolsbee and Raphael Bostic. On Thursday, focus will return to major data releases, including the U.S. Producer Price Index (PPI), which is projected to see its core measure increase by 0.2% after holding steady in June. Weekly jobless claims figures will also be released that day.
The week will conclude with a broader look at U.S. consumer activity. July retail sales are forecast to slow from 0.6% to 0.5%, while core retail sales are expected to drop from 0.6% to 0.3%. Hours later, the preliminary August reading of the University of Michigan Consumer Sentiment Index will be released, providing insights into consumer expectations and confidence.
According to ISM data, pricing pressures have eased in the manufacturing sector but have jumped sharply in the services sector, which makes up a much larger share of the U.S. economy. This suggests that upcoming CPI and PPI reports carry an upside risk relative to forecasts. Inflation readings above expectations—even before fully factoring in the impact of retaliatory tariffs—could erase part of the market’s anticipated rate-cut outlook.

Different Strats, Same ChartICT, SMC, breakout traders, trendline traders… everyone swears they’ve got a unique edge, but it’s all pointing to the same POI. Same price, same reaction. Doesn’t matter what you call it — the market delivers the same setup for everyone, only difference is how you see it.
