Nasdaq Short: Catching a rising knife. Stop loss at 23500.Hi everyone, here I am trying to catch the peak of Nasdaq again. As mentioned, the previous idea was stopped out at 23,320. Now, for this idea, I am attempting another short with a 30 points risk for Nasdaq. The stop for this idea is fixed at 23,500. The take profit is 22,650.
This is a positional trade and I will re-evaluate as the waves unfolds. So the strategy will mainly be trailing the stop periodically.
Thank you and good luck!
USTEC trade ideas

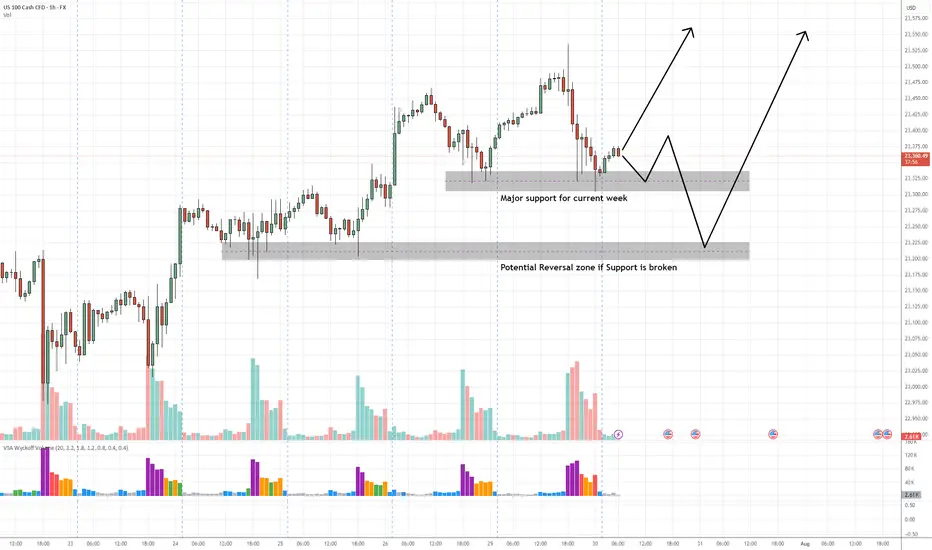
NAS100 Buy Setup – VSA & Multi-Zone Demand Analysis✅ Primary Entry Zone: Major support for current week (around 23,325–23,350)
✅ Secondary Entry Zone: Potential reversal zone if primary support is broken (around 23,200–23,230)
🎯 Target 1 (TP1): Previous swing high near 23,500
🎯 Target 2 (TP2): Extension above 23,550
🛑 Stop Loss (SL): Below 23,170 (beyond secondary reversal zone to avoid false breaks)
📊 Technical Insight (VSA & Price Action Structure)
Support Structure:
The current major support zone has been tested multiple times with no follow-through selling, indicating strong buying interest from larger players.
Volume Spread Analysis Observations:
On the recent decline into the major support zone, we see wider spreads on high volume followed by narrow range candles on lower volume, a classic sign of stopping volume and supply exhaustion.
Within the secondary reversal zone, historical reactions show climactic volume spikes leading to sharp reversals, suggesting this level is watched closely by smart money.
Any test back into the zone on low volume would confirm the No Supply (NS) condition.
Trade Pathways:
Scenario 1: Price respects the major support and begins to climb, confirming demand dominance → target TP1 then TP2.
Scenario 2: Support is temporarily breached, triggering a liquidity grab into the secondary reversal zone, followed by a bullish reversal bar on high volume → strong buy signal with potentially faster move toward TP levels.
📍 Bias: Bullish as long as price holds above the secondary reversal zone.
📌 Execution Tip: Wait for a wide spread up-bar on increased volume from either zone to confirm the start of the markup phase.
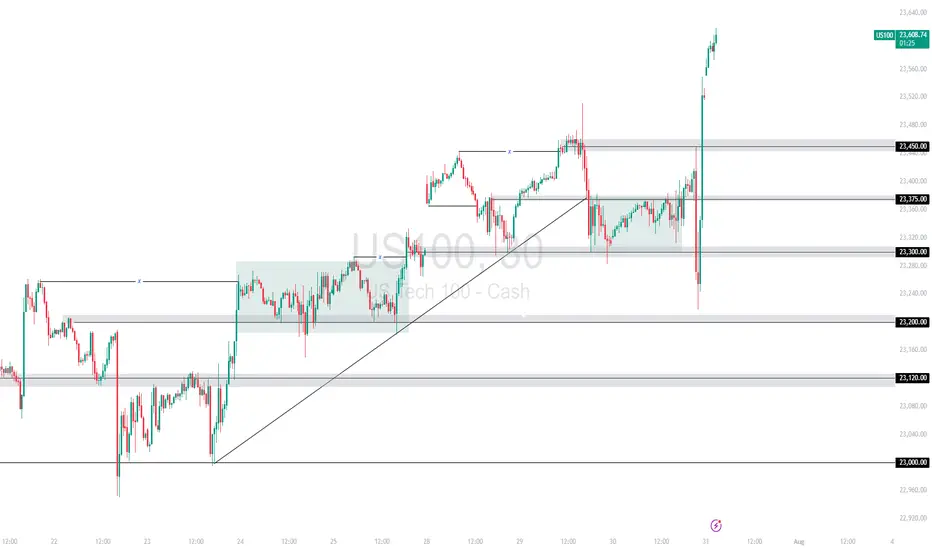
US100 Surges on Strong Fed Data and Trump Trade Deals A combination of upbeat economic data from the Fed and renewed optimism from Trump’s trade announcements fueled a powerful bullish rally on the US100. Price broke above the 23,450 🔼 resistance after reclaiming the 23,300 🔽 zone, leaving behind a strong V-shaped recovery from 23,200 🔽.
Support Levels: 23,450 🔽, 23,375 🔽, 23,300 🔽
Resistance Levels: None locally – price is printing new highs
Bias:
🔼 Bullish: Holding above 23,450 could support further upside. A clean retest may offer continuation entries.
🔽 Bearish: A drop back below 23,450 would weaken the rally and may open the path to 23,375 or 23,300.
📛 Disclaimer: This is not financial advice. Trade at your own risk.
NAS - LONGWaiting to see how news affects the markets today. IF we hold this area and we get confirmation that buyers are taking over. I will enter long and target previous highs.
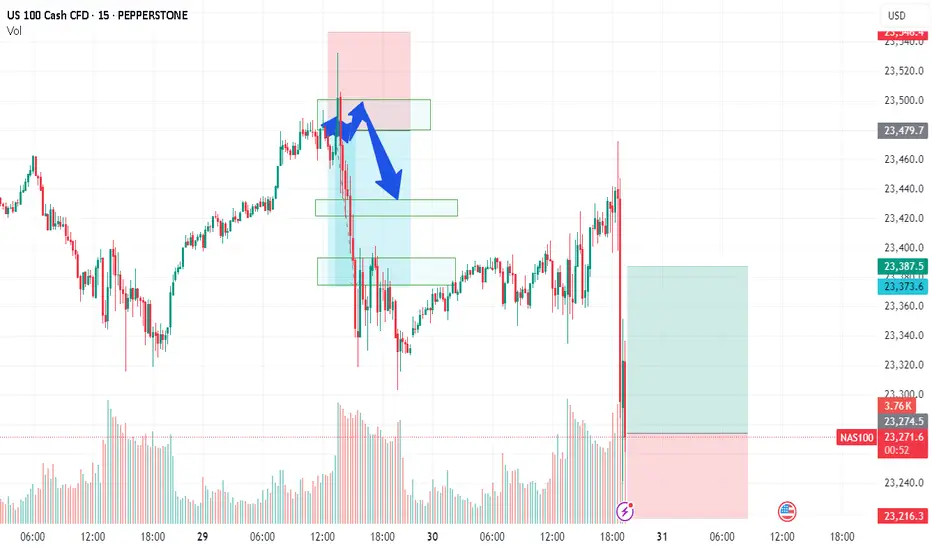
NAS100 - EXPECTING THE DUMPTeam, we got short well today with AUS200 - both target hit
we have set up the NAS entry , this is the entry price 23268 - 23200
STOP LOSS at 23100
Once it break above 23320 - bring stop loss to BE
Target 1 at 23320-60 - take 50%-70& partial
Target 2 at 23380-23400
LETS GO
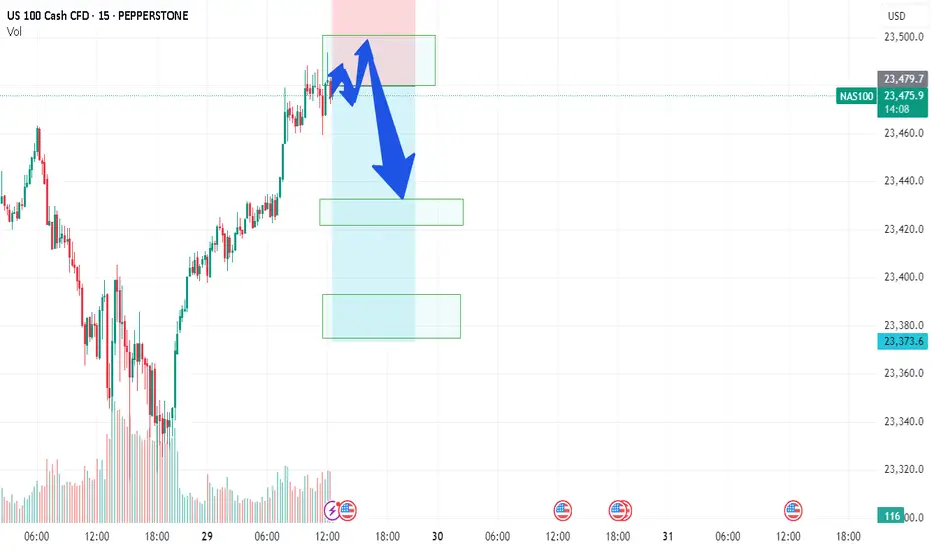
US100/NQ short idea PM session I expect yesterdays high to hold. For NQ reaching a discount, a 400 point move can happen. WATCH A 5m FVG formation for entry

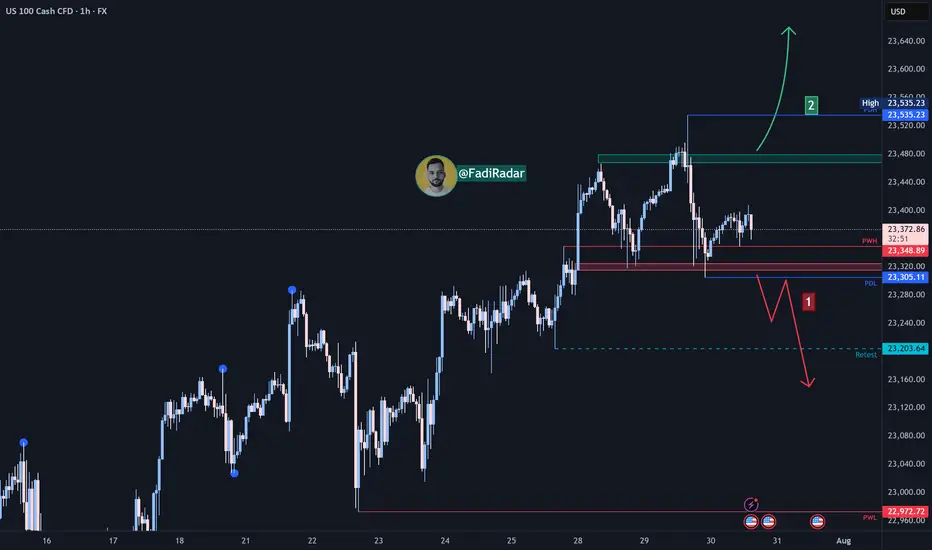
Nasdaq Index Analysis (US100 / NASDAQ):The Nasdaq index is currently sweeping liquidity above the resistance zone and pulling back.
1️⃣ The more likely scenario is a break and close below 23,330 USD, which may lead to a decline toward 23,200 USD, followed by 23,000 USD.
2️⃣ However, if the price holds above 23,480 USD, a continuation of the uptrend is expected, potentially forming a new high.
⚠️ Disclaimer:
This analysis is not financial advice. It is recommended to monitor the markets and carefully analyze the data before making any investment decisions.
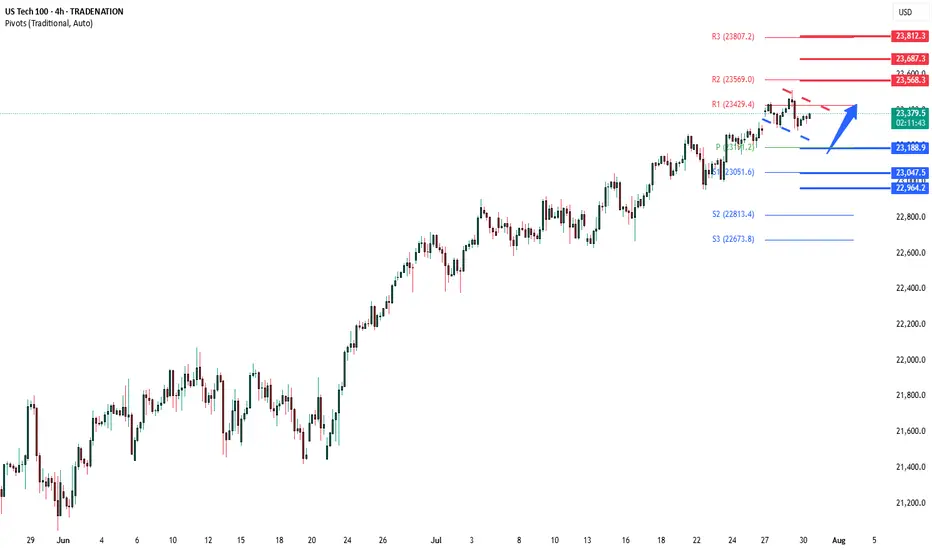
NSDQ100 important support at 23188US equities pulled back, breaking a six-day winning streak for the S&P 500 (-0.30%) as sentiment cooled ahead of key earnings and the Federal Reserve’s rate decision. The Nasdaq 100 (NDX) was weighed down by weakness in megacap tech stocks—the Mag-7 fell -0.68%, with Meta declining -2.46% and Microsoft earnings due after the close.
Post-earnings disappointments also pressured tech-related sentiment. PayPal slumped -8.66% on soft volume growth, despite unveiling a new crypto merchant feature, and UnitedHealth fell -7.46% on weaker sales. These sharp declines indicate heightened sensitivity to earnings misses in a market priced for perfection.
Meanwhile, market volatility could rise amid geopolitical jitters. A massive magnitude-8.8 earthquake in Russia’s Far East triggered tsunami alerts across the Pacific, briefly affecting Hawaii, California, and Shanghai. While many warnings were later downgraded, the event injected caution into markets.
On the macro front, investors are bracing for the Fed’s rate decision later today. The central bank is expected to hold rates steady, but traders are watching closely for guidance on future cuts—particularly in light of Trump’s renewed pressure for easing and ongoing global trade uncertainty, including tariff threats toward India.
Conclusion for Nasdaq 100 Trading:
With sentiment fragile and earnings risk front and center, traders in the Nasdaq 100 should expect near-term volatility, especially around Microsoft and Meta's earnings reports. The tech sector's leadership is under pressure, and any disappointing results could drag the index lower. Watch the Fed’s tone closely—a neutral or hawkish stance could further weigh on rate-sensitive tech. Cautious positioning or selective hedging may be warranted, particularly as geopolitical risks and trade policy uncertainty resurface.
Key Support and Resistance Levels
Resistance Level 1: 23568
Resistance Level 2: 23687
Resistance Level 3: 23812
Support Level 1: 23188
Support Level 2: 23047
Support Level 3: 22965
This communication is for informational purposes only and should not be viewed as any form of recommendation as to a particular course of action or as investment advice. It is not intended as an offer or solicitation for the purchase or sale of any financial instrument or as an official confirmation of any transaction. Opinions, estimates and assumptions expressed herein are made as of the date of this communication and are subject to change without notice. This communication has been prepared based upon information, including market prices, data and other information, believed to be reliable; however, Trade Nation does not warrant its completeness or accuracy. All market prices and market data contained in or attached to this communication are indicative and subject to change without notice.
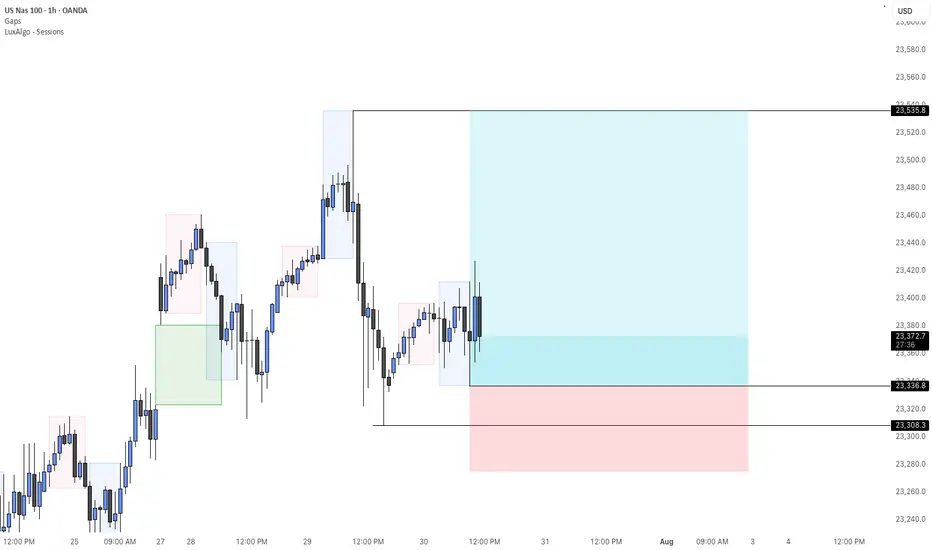
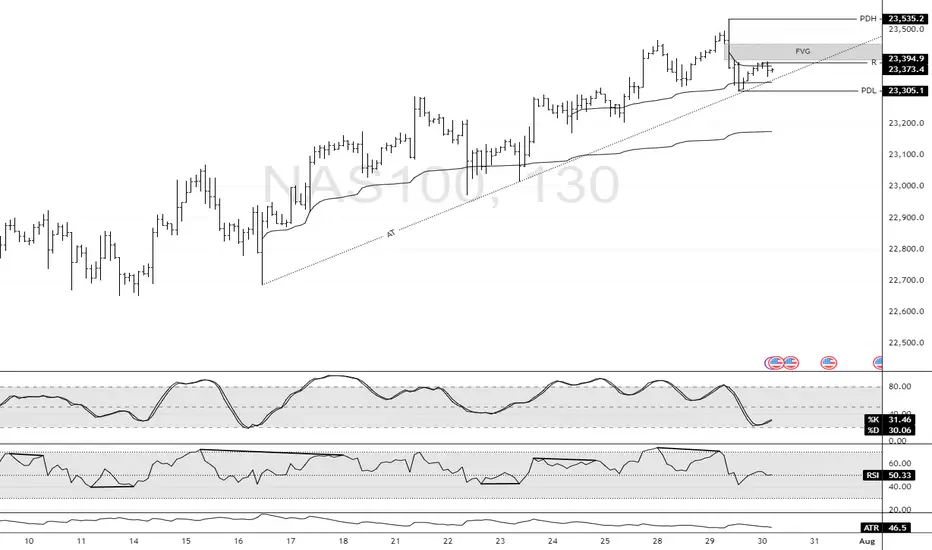
Nasdaq Finds Support at $23,305.0FenzoFx—Nasdaq dipped yesterday and formed a bearish FVG. However, the selling pressure eased as soon as the price tested the ascending trendline.
The last day's low at $23,305.0 is the immediate support. That said, a close above the immediate resistance at $23,375.0 can trigger the uptrend, targeting the highs at $23,535.0.
NAS100 MAY FORM THE BEARISH HEAD AND SHOULDERS.NAS100 MAY FORM THE BEARISH HEAD AND SHOULDERS.
NAS100 has been trading sideways since the beginning of the week, forming local highs with lows staying at same price for the most part. The price seem to form the Head and Shoulders reversal pattern
What is a Head and Shoulders?
A Head and Shoulders pattern is a reversal chart pattern signaling a potential trend change. It consists of three peaks: two lower "shoulders" and a higher "head" in the middle, connected by a "neckline" (support level). A bullish (inverse) Head and Shoulders forms at a downtrend's end, signaling an uptrend; a bearish Head and Shoulders forms at an uptrend's end, signaling a downtrend.
Currently the SMA50 is pushing on NAS100 from above, while SMA200 is supporting the price. In case the SMA200 on 30-m minutes timeframe gets broken, we may see the decline towards 23,200.00 support level.

MIDWEEK FORECAST WHAT TO LOOK FOR WHEN WEARING THE MARKET LENSLess is more when you are looking for setups you can just check how am not complicating my charts yet am always finding setups everyday

NAS100 - Potential TargetsDear Friends in Trading,
How I see it,
I know I'm posting the same old overbought pattern...
"I think I found a background I like at last - Just Testing"
1) A previously discussed we will notice a "SIGNAL" Type candle
2) It can be on 1HR-4HR-1D TF
3) Today is FOMC and Friday NFP
These two events will for sure give us the signals we need to clarify
the way forward
Let this very important week play out, I'll touch base again next week
I sincerely hope my point of view offers a valued insight
Thank you for taking the time study my analysis.

NAS/TEC100 - LETS GET NASTY ON NAS100Team, NAS currently sitting at 23480, before the US market open
however during the market open, please be aware of the volatility that may hit your stop loss
You have 2 options to trade on this NAS- NASTY
Option 1: wait for market open, if it hits 23500-23515 - then short with stop loss at 23580
Option 2: Short at the current market with small volume - and if the market open with volatile, you can take another advantage of shorting more volume as per option 1 instructed.
OK, pick your strategy! do NOT be shy.
I am going to have small short position and will consider adding more during US market opening after 5-10 minutes, much easier to see the direction of the market - we do LIVE trading everyday. Please note: if NAS fall below 23450-40 bring stop loss to BE (Break even)
1st TARGET range: 23435-23416 - make sure take 70% volume
2nd target at 23390 to 23376
Why do I short on NAS when tomorrow rate decision, i think this quarter report, market will not be the same as last quarter, even rate cut!
NASDAQ (CASH100) SHORT - Double top H6Risk/reward = 4
Entry price = 23 463.1
Stop loss price = 23 534.2
Take profit level 1 (50%) = 23 169
Take profit level 2 (50%) = 23 169
All variables met. Now just need price to reach entry level and close back within range.
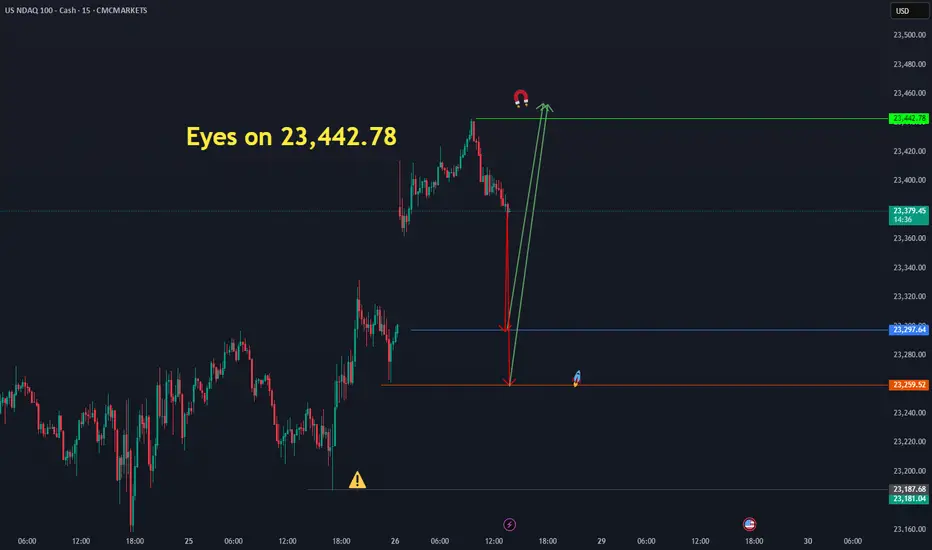
Eyes on 23,442.78 ( us 100 )The Nasdaq has the potential to move upward from the identified price levels of 23,297.64 and 23,259.52, targeting 23,442.78." CMCMARKETS:NDAQ100
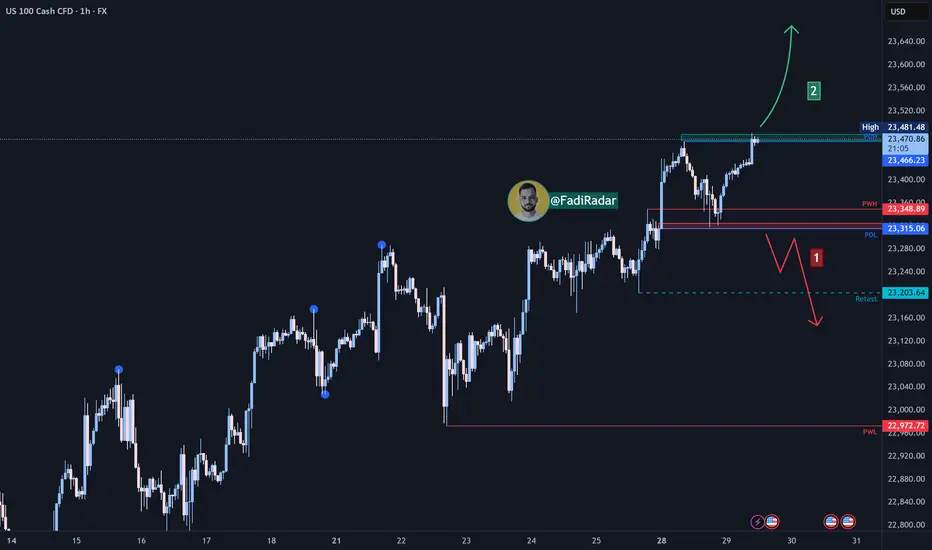
Nasdaq Index Analysis (US100 / NASDAQ):The Nasdaq index continues its medium- to long-term bullish trend, recently reaching a new high at 23,477 USD.
1️⃣ A break and close below 23,330 USD could trigger a pullback toward 23,200 USD, followed by 23,000 USD.
2️⃣ However, if the price holds above 23,480 USD, a continuation of the uptrend is expected, potentially forming a new high.
⚠️ Disclaimer:
This analysis is not financial advice. It is recommended to monitor the markets and carefully analyze the data before making any investment decisions.
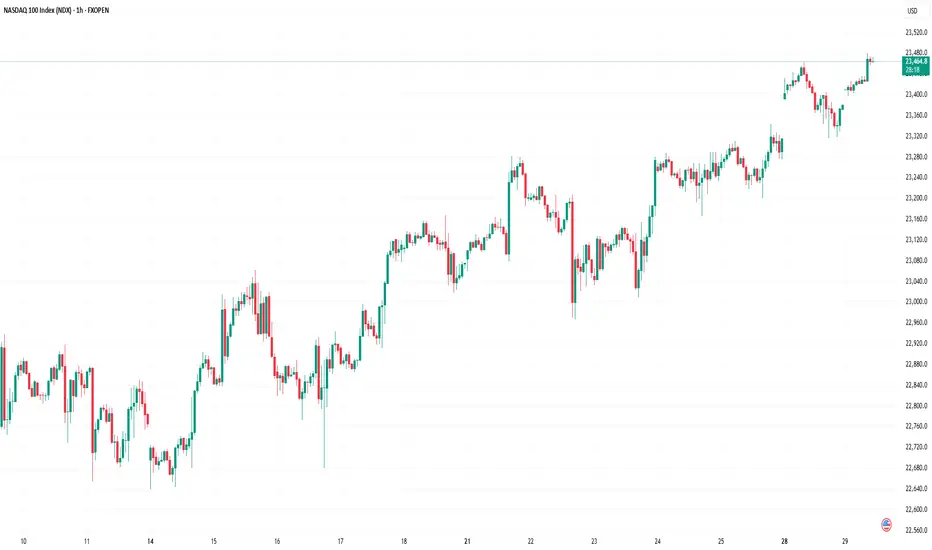
Nasdaq 100 Index Hits New Highs Ahead of Big Tech EarningsNasdaq 100 Index Hits New Highs Ahead of Big Tech Earnings
Earlier, we noted signs of optimism in the Nasdaq 100 index as the market anticipated earnings reports from major tech firms.
Now, companies such as Alphabet (GOOGL) and Tesla (TSLA) have already released their results (we previously covered their charts → here and here). Up next are the most highly anticipated earnings reports: this week, tech giants including Microsoft (MSFT), Amazon (AMZN), Meta Platforms (META), and Apple (AAPL) are set to publish their results. The combined market capitalisation of these four companies exceeds $11 trillion, and their reports could have a significant impact on a stock market that is already showing strong bullish sentiment:
→ The Nasdaq 100 index has climbed to an all-time high, surpassing the 23,400 mark.
→ The signing of trade agreements between the US and Europe (and earlier, Japan) has eased concerns about the negative impact of tariff barriers.
Technical Analysis of Nasdaq 100
The chart supports growing signs of optimism: earlier in July, the price remained within a rising channel (marked in blue). However, towards the end of the month, price action has begun to follow a steeper upward trajectory (marked in purple).
What could happen next? Much will depend on the earnings results and forward guidance from these tech giants.
On the one hand, continued enthusiasm around AI adoption could accelerate further growth. The stronger the optimism, the more fuel it may add to discussions around a potential bubble — with some analysts already drawing parallels to the dot-com era of the early 2000s.
On the other hand, earnings could temper market excitement and prompt a correction. For example, the index may retreat to the support level around 23,020, which is reinforced by the lower boundary of the blue trend channel.
This article represents the opinion of the Companies operating under the FXOpen brand only. It is not to be construed as an offer, solicitation, or recommendation with respect to products and services provided by the Companies operating under the FXOpen brand, nor is it to be considered financial advice.
NextGenTraders81 NAS short swingI have my sell limit set at 23,500 as there is alot of sell limits set there, also at 23,550 hence the SL is above that zone.
I am pretty sure the position will be set on BE before it tries to return to these highs, how long it will take to hit TP, who knows.. a correction within the channel is due after numerous ATHs.
If you will follow, take partials on the way !
Good luck :)

NASDAQ Channel Up to be rejected soon.Nasdaq (NDX) has been trading within a Channel Up since the start of the month. The primary Support level has been the 4H MA50 (blue trend-line), which hasn't closed a 4H candle below it since July 14.
Right now the index is on its latest Bullish Leg, which can technically extend by +2.35% (max such Leg within the Channel Up).
We expect a rejection targeting the 4H MA50 again at 23200, which would represent a -1.25% decline, the weakest such Bearish Leg we had within the Channel Up.
-------------------------------------------------------------------------------
** Please LIKE 👍, FOLLOW ✅, SHARE 🙌 and COMMENT ✍ if you enjoy this idea! Also share your ideas and charts in the comments section below! This is best way to keep it relevant, support us, keep the content here free and allow the idea to reach as many people as possible. **
-------------------------------------------------------------------------------
Disclosure: I am part of Trade Nation's Influencer program and receive a monthly fee for using their TradingView charts in my analysis.
💸💸💸💸💸💸
👇 👇 👇 👇 👇 👇

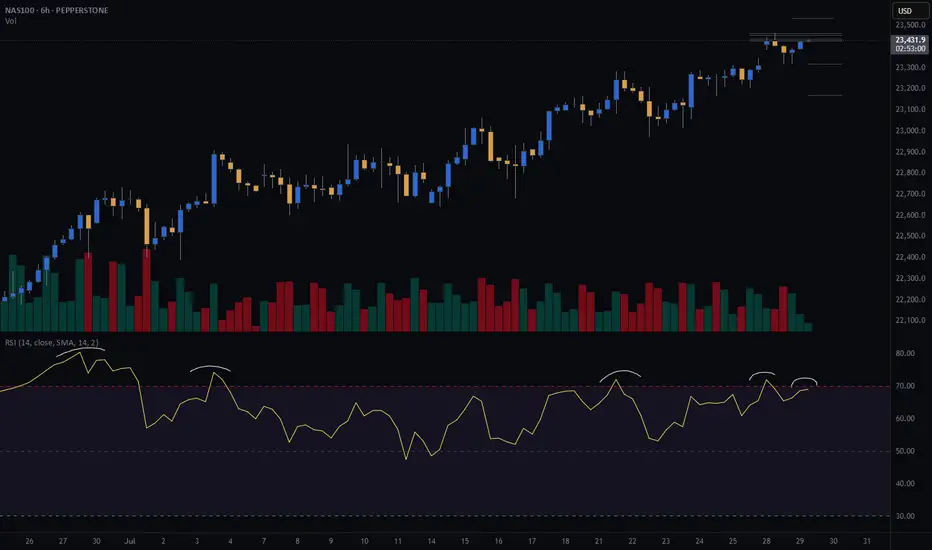
US100 (NASDAQ 100 Index) – Breakout with Clear Upside ProjectionUS100 has broken out cleanly above the key resistance at 22,097.1, indicating bullish continuation. The breakout is supported by strong upward momentum, targeting the next key level around 23,441.9, as illustrated by the projected range.
Support at: 22,097.1 🔽 | 20,750.0 🔽
Resistance at: 23,441.9 🔼
🔎 Bias:
🔼 Bullish: Sustained price action above 22,097.1 keeps the bullish breakout valid, aiming toward 23,441.9.
🔽 Bearish: A drop back below 22,097.1 would invalidate the breakout, possibly pulling price toward 20,750.0.
📛 Disclaimer: This is not financial advice. Trade at your own risk.

NASDAQ Potential UpsidesHey Traders, in today's trading session we are monitoring NAS100 for a buying opportunity around 23,140 zone, NASDAQ is trading in an uptrend and currently is in a correction phase in which it is approaching the trend 23,140 support and resistance area.
Trade safe, Joe.

NASDAQ Potential UpsidesHey Traders, in today's trading session we are monitoring NAS100 for a buying opportunity around 23,300 zone, NASDAQ is trading in an uptrend and currently is in a correction phase in which it is approaching the trend at 23,300 support and resistance area.
Trade safe, Joe.

NAS100 shortElite analysis
Confirmed the entire checklist
Targeting lower liquidity pools.
Main Target NY Low.
This was confirmed from Daily all the way down to 1m.
