TLM Holding above key levelTLM : holding above key level in blue box,
Breakout descending trendline,
Strong supports below
TLMUSDT trade ideas


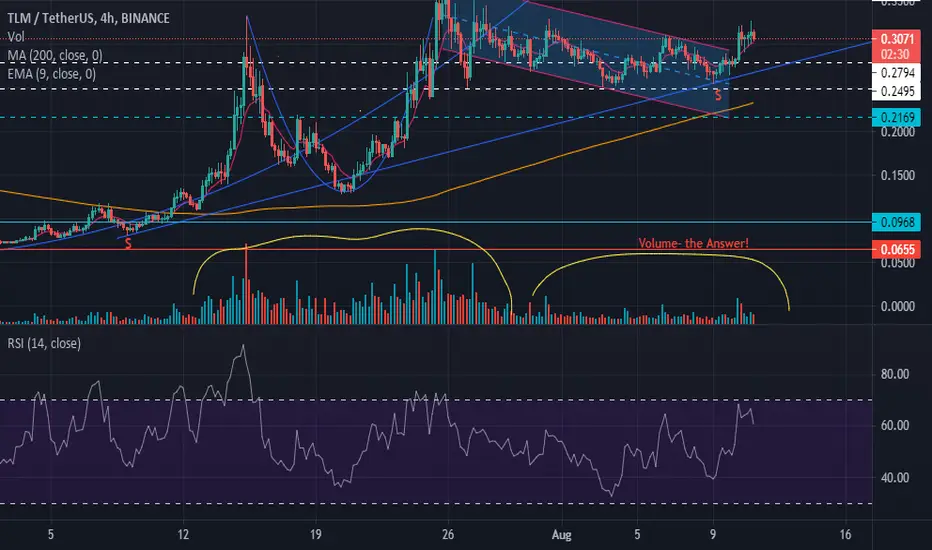
$TLM- It will Come. PatientJust like a little poke from $btc is awakening all the deaden Alts lying lazily below 200 MA for weeks? TLM will come! Those targets will be hit
You just have to wait for its time.
All this slow moment is for the big things.
Notice the variance during the time of mooning and now? Those volumes need to build and come back up.
bullish tlmhi everyone.
If we do not have FUD and the BIT does not fall I will expect at least 0.35 for TLM in the short term.
lets go


#TLM / TETHERUS entered a big bullish wave The go#tlm
I entered a downtrend and entered a big bullish wave
The goals are illustrated

TLMUSDT Descending Triangle | Bullish Break & Retest DoneTLMUSDT Descending Triangle | Bullish Break & Retest Done | 96% Move Ahead
NOTE: Do your own analysis. Do proper risk and money management. Spot Trading Only.
Entry: 0.3161
TP1: 0.3739
TP2: 0.4334
TP3: 0.5104
TP4: 0.6200
SL: 0.2520
ROI: 90% - 96%
Risk: 20%
This is a high-risk trade so if you don't know how to trade or how to secure your money or your running profits, do not enter into trade. I will not be responsible for the loss.

#TLM Break the resistance#TLMUSDT Break the resistance and need to close 3Daily above them , that is new start for tlm , it can going to 0.43 , 0.60 , 0.80 , 1$ soon


TLMUSDTPrice broke through resistance and tested support, where it is sitting on top now. Targeting 50 cent.

TLM possible $0.10 hike Broke upwards out of triangle with RSI looking good and MACD cross up on 8 hour. Hopefully take us to $0.39

TLM Resistance Breakout & SupportTLM
Heavy Support .2550
Miner Support .2650
Resistance .2891
Breakout Area .3050 - .3296

TLM at the edge of the triangle, will potentially shoot up soonOn a higher TF, TLM is moving in a symmetrical triangle, with all pressure residing towards the upper channel. This is a sign that it has higher probability of breaking up soon.
From past few days it has found strong support at 0.25 zone and it might test same zone again, which could be our potential entry point for going LONG.
I have highlighted the are which is best for going long.
If you like my analysis then do drop a LIKE and a COMMENT. Also do SHARE it with your friends.
Also don't forget to smash that FOLLOW button to get daily analysis of multiple crypto currencies and sometime ASX stocks.
Note - These are my personal notes and in no way a financial advice. Do your own research and Trade wisely

TLMUSDT - BULLISH SIGNAL UPDATEAs you all know, TLM is not performing well from last 2 months and according to the Chart patterns, Ascending Channel is formed and also indicators giving bullish signal.
Short term Trade, DYOR Before taking trade, as i'm not responsible for your loss.
RISK FACTORS:
Market/BTC CRASH
Happy Trading :)
Good Luck!
If you like my idea, please support:
Binance Smart Chain ( BSC ): 0x69Ea86D0f6B762fC36A322b0C833D2bd04534b3d
TLMUSDT If you are patient after the throwback, I think you will get the targets respectively..
possible TOBO target and 2nd target partner..
I aim to increase my earnings percentage by selling as I get the targets..
lots of earnings

TLM LONG OR SHORTI am LONG if we break the resistance level and I am SHORT if we break the support!
TP and SL is on a chart
Don't risk! DYOR!

TLMUSDT - UPDATETLM has bounced of this strong demand zone since making a correction and is also trying to now break above of this descending channel on the 4hr timeframe, i am expecting a strong breakout to occur final target is 0.4000

TLMbuyers power is obvious for me , i think they can push my long bag to pleasant profit in some next days , we will see , TLM holders be patience and hodl , great reward coming soon

#TLMUSDT 8H chart
Price is ranging in a descending triangle pattern. Price rejected its resistance line and now it is heading down. RSI and EMA ribbon are not showing clear indications but MACD lines just crossed and is now bearish. Overall we also need to wait for the breakout in order to consider entering a position.

TLM BulishTLM has been a weeks consolidated at 0.2 area and 4H RSI has reset and now it about to breakout to 0.4 target

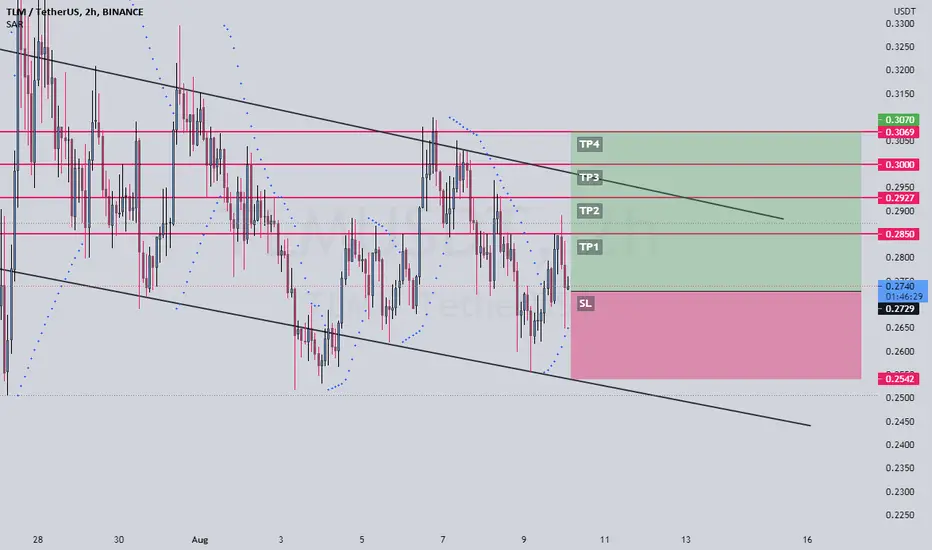
TLM - Wait for the breakoutAnalyze the chart and wait for the breakout the support is around 2.5 and another at 2.2 (you can do +-). The target is .31, .37, Always do your own research too. I'm looking for Long

