NATGAS LONG TERM TRADE analysHello Traders
In This Chart NATGAS HOURLY Forex Forecast By FOREX PLANET
today NATGAS analysis 👆
🟢This Chart includes_ (NATGAS market update)
🟢What is The Next Opportunity on NATGAS Market
🟢how to Enter to the Valid Entry With Assurance Profit
This CHART is For Trader's that Want to Improve Their Technical Analysis Skills and Their Trading By Understanding How To Analyze The Market Using Multiple Timeframes and Understanding The Bigger Picture on the Charts
LNG1! trade ideas

Strong Manipulation Natural gas futures price is well known for manipulation.
All traders who bought the GAP at 2.669 $ /MMBtu are being liquidated. This is a comprehensive movement to collect all the last contract at lower prices before exploding up.
Can you imagine a world in 2024-2025 with less gas than usual ?
Whales are accumulating , what will you do ?

✅NATGAS BUYING OPPORTUNITY|LONG🚀
✅NATGAS gapped down and
Then went even further down
So the commodity is locally
Oversold and as the horizontal
Support of 2.250 is ahead
I will be expecting a
Local bullish correction
LONG🚀
✅Like and subscribe to never miss a new idea!✅

Update on $MCX:NATURALGAS1!Dear Followers,
I hope this message finds you well. I wanted to provide you with a brief update on the stock MCX:NATURALGAS1! I have been monitoring.
It appears that the stock is approaching a potential Support level Near 192-190 This is an important technical point where the price has historically had difficulty breaking through. It suggests that we may see a temporary halt in the current upward momentum and Possibly it will test 215-220 In Upmove.
According to Technical Analysis Naturalgas Will be good to buy Near 190-192, Sl 175, Target 210,220,235.
Time Frame- 12-15 Days.
Resistance Levels to Watch out.
Resistance levels are the opposite, representing prices at which a stock has historically struggled to move above. These levels can signal a selling interest. Understanding resistance points is crucial for anticipating potential obstacles in the upward movement of a stock.
R1= 220
R2= 245
R3= 265
Support Levels To Watchout.
Support levels represent prices at which a stock has historically had difficulty falling below. These levels often indicate a strong buying interest. It's important to monitor these levels, as a breach might suggest a potential downward trend.
S1= 190
S2= 178
S3= 165
As always, please remember that investing involves risks, and it's important to carefully consider your options. If you have any questions or would like to discuss this further, please don't hesitate to reach out.
Best regards,

Natural Gas Futures Bullishly Diverging at a Bullish Bat PCZNatural Gas Futures aggressively gapped down into support during the first hour of this week's trading and looks to be ready to form some MACD Bullish Divergence leading into the rest of the week. I think there is a good chance that Natural Gas at least undoes this decline and rises back up to $2.5 this week, but overall if this ends up being a major bottom I'd expect it to pump well into the mid to upper 3 dollar range.

NATGAS The Target Is UP! BUY!
My dear subscribers,
My technical analysis for NATGAS is below:
The price is coiling around a solid key level - 2.519
Bias - Bullish
Technical Indicators: Pivot Points Low anticipates a potential price reversal.
Super trend shows a clear buy, giving a perfect indicators' convergence.
Goal - 2.869
About Used Indicators:
By the very nature of the supertrend indicator, it offers firm support and resistance levels for traders to enter and exit trades. Additionally, it also provides signals for setting stop losses
———————————
WISH YOU ALL LUCK

NATGAS: Bullish Continuation & Long Signal
NATGAS
- Classic bullish formation
- Our team expects growth
SUGGESTED TRADE:
Swing Trade
Buy NATGAS
Entry Level - 2.519
Sl - 2.356
Tp - 2.926
Our Risk - 1%
Start protection of your profits from lower levels
❤️ Please, support our work with like & comment! ❤️

NATURAL GAS Stock Chart Fibonacci Analysis 011924Trading Idea
1) Find a FIBO slingshot
2) Check FIBO 61.80% level
3) Entry Point > 2.6/61.80%
Chart time frame : B
A) 15 min(1W-3M)
B) 1 hr(3M-6M)
C) 4 hr(6M-1year)
D) 1 day(1-3years)
Stock progress : B
A) Keep rising over 61.80% resistance
B) 61.80% resistance
C) Hit the bottom
D) Hit the top
Stocks rise as they rise from support and fall from resistance. Our goal is to find a low support point and enter. It can be referred to as buying at the pullback point. The pullback point can be found with a Fibonacci extension of 61.80%. This is a step to find entry level. 1) Find a triangle (Fibonacci Speed Fan Line) that connects the high (resistance) and low (support) points of the stock in progress, where it is continuously expressed as a Slingshot, 2) and create a Fibonacci extension level for the first rising wave from the start point of slingshot pattern.
When the current price goes over 61.80% level , that can be a good entry point, especially if the SMA 100 and 200 curves are gathered together at 61.80%, it is a very good entry point.
As a great help, tradingview provide these Fibonacci speed fan lines and extension levels with ease. So if you use the Fibonacci fan line, the extension level, and the SMA 100/200 curve well, you can find an entry point for the stock market. At least you have to enter at this low point to avoid trading failure, and if you are skilled at entering this low point, with fibonacci6180 technique, your reading skill to chart will be greatly improved.
If you want to do day trading, please set the time frame to 5 minutes or 15 minutes, and you will see many of the low point of rising stocks.
If want to prefer long term range trading, you can set the time frame to 1 hr or 1 day.

nat gas setting up the buy in march and aprilNat gas nice tight buy zone from 220-225.... Lets see if we hit and bounce
targets are 250 and 270

Natural Gas at historically significant levels. All in the video. I'm collecting Nat gas near these levels and I explain why in the video - I hope it's helpful - good luck!

Red Sea Crisis: How it will trigger the market?The recent development of the Red Sea crisis does not suggest that it is going to resolve anytime soon.
Which markets have already started moving? And how far will they rise this time?
We are going to recap the supply chain crisis during the pandemic and also delve into the current supply chain disruption caused by the Middle East conflict, which has led to the Red Sea crisis.
My name is Kon How, and my role in this channel, as always, is to study behavioral science in finance, discover correlations between different markets, and uncover potential opportunities.
Henry Hub Natural Gas Futures and Options:
Minimum fluctuation: 0.001 per MMBtu = $10.00
Code: NG
Disclaimer:
• What presented here is not a recommendation, please consult your licensed broker.
• Our mission is to create lateral thinking skills for every investor and trader, knowing when to take a calculated risk with market uncertainty and a bolder risk when opportunity arises.
CME Real-time Market Data help identify trading set-ups in real-time and express my market views. If you have futures in your trading portfolio, you can check out on CME Group data plans available that suit your trading needs www.tradingview.com

Near flag pattternIn English
A bear flag is a bearish chart pattern that's formed by two declines separated by a brief consolidating retracement period. The flagpole forms on an almost vertical panic price drop as bulls get blindsided from the sellers, then a bounce that has parallel upper and lower trendlines, which form the flag.

NG is a buy with S/L 2.69Entry Price: Enter the trade at the current market price of 2.80.
Stop Loss: Place a stop-loss order at 2.69, which is slightly below the recent support level. This will limit your potential losses if the price of NG falls unexpectedly.
Target Prices: Take partial profits at the first target price of 3.00 and consider trailing the stop-loss to lock in profits. The second target price of 3.20 can be used as an exit point for the remaining position.

NGIt is currently NG in a downward trend, but if the stop loss is reached and the green zone is entered, we will open a buy deal

Natural Gas Probes Support. Is One More Feb '24 Bounce Possible?The US Natural Gas Fun (UNG) paces for its third-worst single-session performance in the ETF's 17-year history as of this writing. Tuesday afternoon weather model runs did the prompt-month of natural gas no favors, and the February contract has plunged all the way back under $3 after poking above $3.30 late last week. The current record-shattering polar snap will prove to be short-lived for the CONUS. A mild forecast in both the NOAA 6-10 day and 8-14 day outlooks are bearish for the energy-dependent commodity.
This is the most volatile time of the year for nat gas, and the infamous “widowmaker” trade (the March/April spread) looms. For now, though, I see support on the chart in a broad range. Notice in my featured chart this week that $2.80 to $3.00 has historically been a battleground between the bulls and bears. What’s more, natty is now testing its 38.2% retracement from the December low to the January high, offering potential support.
The trade here, in my view, is long with a stop under $2.80 on the prompt month. We will have a contract roll later this month to the much cheaper March contract (currently about 45 cents less expensive than Feb). So, we will get a natural gap down once the roll takes place. Thus, the duration of this idea is through January 26.

NATGAS Trading Opportunity! SELL!
My dear followers,
I analysed this chart on NATGAS and concluded the following:
The market is trading on 3.331 pivot level.
Bias - Bearish
Technical Indicators: Both Super Trend & Pivot HL indicate a highly probable Bearish continuation.
Target - 3.061
About Used Indicators:
A super-trend indicator is plotted on either above or below the closing price to signal a buy or sell. The indicator changes color, based on whether or not you should be buying. If the super-trend indicator moves below the closing price, the indicator turns green, and it signals an entry point or points to buy.
———————————
WISH YOU ALL LUCK

Natural Gas DXY Gold Silver Oil Price Forecast00:00 Natural Gas stock Bulls NatGas Support & Resistance Guide
03:43 AMEX:UNG Stock Forecast
04:16 USO Oil Stock Forecast
05:13 DXY US dollar Stock Forecast
06:16 Gold XAUUSD Stock Forecast
07:03 Silver XAGUSD

NATGAS: Expecting Bearish Movement! Here is Why:
Looking at the chart of NATGAS right now we are seeing some interesting price action on the lower timeframes. Thus a local move down seems to be quite likely.
❤️ Please, support our work with like & comment! ❤️

only gas triggered a COT long signaltargets and entries are clear on the daily chart (prior highs and entries/exits at 50% level of prior wicks)
to keep the risk low entering at such areas can be down on an intraday 10 min chart using fair value gap alerts.
looking forward for new long signals at sellside liquidity area.


CL NG CL and NG
Please see video for exact points.
CL might go up and NG might go down according to Seasonalititis ... lol ...
Check recording ...

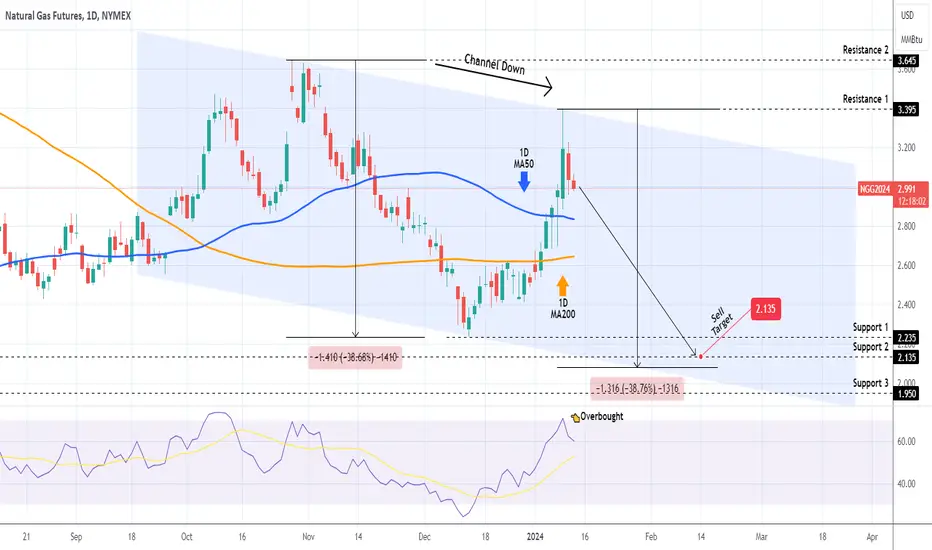
NATURAL GAS Long-term High has been made. SELL.Natural Gas (NG1!) is having a strong bearish reversal since the January 09 High, which on this 1D time-frame can be identified as a Lower High on a 3-month Channel Down pattern. On top of that, the 1D RSI got overbought above 70.00 and is correcting.
This appears to be the new Bearish Leg of the Channel Down and we expect it to last around 1 month. Our Target is a new Lower Low on Support 2 at 2.135.
-------------------------------------------------------------------------------
** Please LIKE 👍, FOLLOW ✅, SHARE 🙌 and COMMENT ✍ if you enjoy this idea! Also share your ideas and charts in the comments section below! This is best way to keep it relevant, support us, keep the content here free and allow the idea to reach as many people as possible. **
-------------------------------------------------------------------------------
💸💸💸💸💸💸
👇 👇 👇 👇 👇 👇
Update on $MCX:NATURALGAS1!Dear Followers,
I hope this message finds you well. I wanted to provide you with a brief update on the stock MCX:NATURALGAS1! I have been monitoring.
It appears that the stock is approaching a potential resistance level Near 10450-10480 This is an important technical point where the price has historically had difficulty breaking through. It suggests that we may see a temporary halt in the current upward momentum and Possibly it will test 240 In Downmove.
Resistance Levels to Watch out.
Resistance levels are the opposite, representing prices at which a stock has historically struggled to move above. These levels can signal a selling interest. Understanding resistance points is crucial for anticipating potential obstacles in the upward movement of a stock.
R1= 250
R2= 258
R3= 265
Support Levels To Watchout.
Support levels represent prices at which a stock has historically had difficulty falling below. These levels often indicate a strong buying interest. It's important to monitor these levels, as a breach might suggest a potential downward trend.
S1= 244
S2= 239
S3= 232
As always, please remember that investing involves risks, and it's important to carefully consider your options. If you have any questions or would like to discuss this further, please don't hesitate to reach out.
Best regards,
