Corn Futures Recover Friday's Losses Corn
Commitments of Traders Update: Friday’s CoT report showed Managed Money were net sellers of 25,871 futures/options contracts through July 19th. 24,916 of this was long liquidation, just 955 were new short positions. This shrinks their net long position to 125,303 contracts. Broken down that is 202,400 longs VS 77,097 shorts.
Fundamentals: Corn futures had another rough week, with the December contract losing 39 ½ cents. Cooler and wetter forecasts working their way into 1-2 week forecast didn’t offer any support. Russia and Ukraine signed a deal on Friday that would open up Ukrainian ports. There were skeptics out of the gate and now even more as Russia bombed Odessa Saturday morning. The strike didn’t appear to have damaged any grain storage, but it certainly doesn’t help build confidence that the agreement will stand.
Technicals (September): Corn futures are rebounding this morning, erasing the losses from Friday’s session. Friday morning, we moved our bias from outright Neutral to Neutral/Bullish, aka cautiously optimistic. The Bulls want to see a conviction close out above our pivot pocket, 574 ¼-579 ¼, to help encourage additional upward momentum towards our resistance pocket, 586-589.
Bias: Neutral/Bullish
Previous Session Bias: Neutral/Bullish
Resistance: 586-589****, 624-630***, 645-652 ½***
Pivot: 574 ¼-579 ¼
Support: 542 ¼-547 ¾***
Futures trading involves substantial risk of loss and may not be suitable for all investors. Trading advice is based on information taken from trade and statistical services and other sources Blue Line Futures, LLC believes are reliable. We do not guarantee that such information is accurate or complete and it should not be relied upon as such. Trading advice reflects our good faith judgment at a specific time and is subject to change without notice. There is no guarantee that the advice we give will result in profitable trades. All trading decisions will be made by the account holder. Past performance is not necessarily indicative of future results.
TGCN1! trade ideas
ZC! STILL IN THE DOWNTREND 🌽Hello ladies and gentlemen, according to my graphical analysis Of The ZC! FUTURES , there is a high probability of drop to the level mentionned in the coming period.


Corn Trades to Lowest Price Since the Start of the YearCorn
Fundamentals: This morning’s weekly export sales report showed net sales of 33,900 MT for 2021/2022 were down 43 percent from the previous week and 82 percent from the prior 4-week average. -Net sales of 570,200 MT for 2022/2023
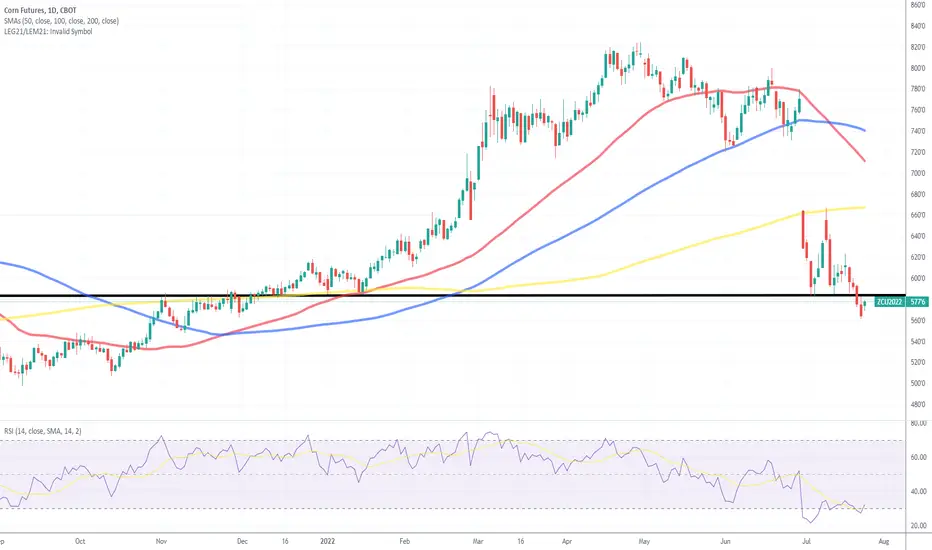
Techncials: Corn futures have broken below our 4-star support pocket from 586-589, taking out the lows from July 5th and 6th. This is now at the lowest trading level since January 24th. Our next support pocket is also being tested this morning, we've had that defined as 574 1/4-579 1/4. This level area was a big resistance area at the end of last year and beginning of this year. The RSI (relative strength index is at 30.8, a hair above what would be considered "oversold".
Bias: Neutral
Previous Session Bias: Neutral
Resistance: 624-630***, 645-652 ½***
Pivot: 586-589
Support: 574 ¼-579 ¼***
Futures trading involves substantial risk of loss and may not be suitable for all investors. Trading advice is based on information taken from trade and statistical services and other sources Blue Line Futures, LLC believes are reliable. We do not guarantee that such information is accurate or complete and it should not be relied upon as such. Trading advice reflects our good faith judgment at a specific time and is subject to change without notice. There is no guarantee that the advice we give will result in profitable trades. All trading decisions will be made by the account holder. Past performance is not necessarily indicative of future results.


Corn Finishing Intermediate Wave 4 with Bearish Seasonality
Corn is currently in minor wave D or E of an intermediate wave 4 triangle. Once corn breaks out of the triangle, it will begin intermediate wave 5 down to at least the 521'0 (0.618 Fibonacci level) area for December corn, possibly lower.
This is also happening during the summer months when corn prices typically decrease. If you bought corn on July 19 and sold corn on December 3 every year for the past 15 years, you would have lost money for 10 of those years (66.66%).
Volatility may remain high during the Russia-Ukraine war, but the price trend is down.

Corn Futures well since last year there has been a 225% increase to the price of corn when I started looking at this chart back in sept of 2021
last year- through november the price has risen 65% in 3 months - with the price rising to 225% in a mere 11 months--- meaning in the next 5 years corn will be over 3300 dollars usd in value
the government doesnt need to create a demand for corn--they need to create inscentives for farmers to produce more food and in large scale of farmer---our farms and crops shouldnt fail to produce and income either---with the price of diesel acting better than gold itself---its no wonder farmers arent pulling out there hair more often.
I am neutral but I know it will rise within the next 11-13 months so do as you choose- farmers traders and investors.
The government is trying to make us all poor and dependant on the gov itself while bitcoin is trying to fix the bad within the world you have surrounding countries like india wanting to ban crypto when they were just given 80 billion dollars from crypto lol --- crypto doesnt need to change the gov needs to stop hurting the dollar- and the tax bill needs to scrapped in every country within the world--- its really bad and sickening that the government wants us to be dependant on them--- when they dont even control money now since the creation of bitcoin its taken 13 years to plant the seed of doubt- and now the government is trying to squeeze us all out of exsistance - by increasing taxes and creating more inflation for the public why yes they are paid healthy every year atleast 100 000 dollars for an average government job --- what happens when 100 k isnt enough and the dollar is shit and your stuck in 80 trillion debt what happens then @whitehouse

Will technical support hold? Corn
Fundamentals: Yesterday’s weekly export inspections came in at 1,073,972 metric tons, right in line with what we saw for the same week last year, 1,076,668 metric tons. Yesterday’s crop progress report showed good/excellent conditions at 64%, unchanged from the previous week. Iowa leads the way with a rating of 81%. Illinois had the biggest weekly gain of +4%, that puts them at 70% G/E. 37% of the crop is silking.
Technicals (September): Corn futures made a run at 4-star resistance yesterday but fizzled out and finished the day close to where we gaped higher on Sunday night. Futures are lower this morning as some forecasts improve. This has dropped prices within a stone’s throw of 4-star support, 586-589. Our bias remains in Neutral territory. We continue believe there will continue to be short term opportunities on both sides of the market as weather continues to have an implication on day-to-day gyrations.
Bias: Neutral
Previous Session Bias: Neutral
Resistance: 627 3/4-631 3/4****, 645-652 ½***, 678 ¼-684 ½**
Support: 586-589****, 574 ¼-579 ¼***
Futures trading involves substantial risk of loss and may not be suitable for all investors. Trading advice is based on information taken from trade and statistical services and other sources Blue Line Futures, LLC believes are reliable. We do not guarantee that such information is accurate or complete and it should not be relied upon as such. Trading advice reflects our good faith judgment at a specific time and is subject to change without notice. There is no guarantee that the advice we give will result in profitable trades. All trading decisions will be made by the account holder. Past performance is not necessarily indicative of future results.

Risk-On!It's a risk-on day in the outside markets with many sectors catching a tailwind on a softening U.S. dollar.
Corn
Commitments of Traders Update: Friday's CoT report showed Managed Money were net sellers of 21,693 contracts, shrinking their net long position to 151,174 contracts. Broken down, 16,972 was long liquidation and 4,721 were new shorts.
Technicals: Corn futures opened higher and turned negative last night. That weakness has turned into strength this morning with a nice tailwind from a weaker U.S. dollar and in turn stronger commodity markets. The first meaningful resistance pocket for September futures doesn't come in until 627 3/4-631 3/4. Our bias was moved to neutral last week, stating our belief that there will be great opportunities for participants on both sides. If the market makes it to resistance, we would consider moving our short-term bias back into bearish territory.
Bias: Neutral
Previous Session Bias: Neutral
Resistance: 627 3/4-631 3/4****, 645-652 ½***, 678 ¼-684 ½**
Support: 586-589****, 574 ¼-579 ¼***
Futures trading involves substantial risk of loss and may not be suitable for all investors. Trading advice is based on information taken from trade and statistical services and other sources Blue Line Futures, LLC believes are reliable. We do not guarantee that such information is accurate or complete and it should not be relied upon as such. Trading advice reflects our good faith judgment at a specific time and is subject to change without notice. There is no guarantee that the advice we give will result in profitable trades. All trading decisions will be made by the account holder. Past performance is not necessarily indicative of future results.

Corn, Commitment of traders, US Dollar, and Corn open interest: An abundance of drivers influencing the Ag markets. Together the Funds and Commercials create a very liquid environment that trends up, down, or sideways. During certain times of extreme macro and/or fundamental influences their combined forces move away from a market looking for fair value to a market driven by fear. Fear can cause strong trending moves higher and lower. But when the marketplace is severely spooked, the funds and commercials seem to completely leave the markets and can do so for an extended period of time. The 95’ short crop caught a lot of HTA (hedge to arrive) bag holders off guard. The HTA debacle and the Rising US Dollar (dot com bust liquidity drain) spooked the market makers enough to drop Open Interest to a very low area from the late 90’s to mid 2000’s. This created a very unwelcoming market structure for corn trading mostly in the lower $2.00 area. I share this to illustrate just one example of how outside influences greatly affect Ag commodities. I hear a lot about recessions pulling money from stocks and into commodities. Sometimes that is the case, but scared money can sit on the sidelines for some time. Too much is going on in the world and capital flows are abnormal. I don’t know where any of these markets are going but it sure seems that for the moment money is moving to the sidelines in many markets…

Chop, ChopCorn
Fundamentals: Consolidation continues to be the name of the game, which was actually encouraging yesterday morning when many other commodity markets were full on risk-off. To us, that indicated good underlying near term strength in the market as we inch closer to the weekend.
Technicals (September): Not much has changed on the technical landscape over the last two and a half sessions. The market is continuing to linger near the middle of our support and resistance pockets. Our bias is outright neutral as we think there will continue to be short term trading opportunities for participants on both sides of the market. We would be looking to flip our bias into bearish territory against resistance and bullish territory against support.
Bias: Neutral
Previous Session Bias: Neutral
Resistance: 624-630*, 645-652 ½, 678 ¼-684 ½
Support: 586-589, 574 ¼-579 ¼**
Futures trading involves substantial risk of loss and may not be suitable for all investors. Trading advice is based on information taken from trade and statistical services and other sources Blue Line Futures, LLC believes are reliable. We do not guarantee that such information is accurate or complete and it should not be relied upon as such. Trading advice reflects our good faith judgment at a specific time and is subject to change without notice. There is no guarantee that the advice we give will result in profitable trades. All trading decisions will be made by the account holder. Past performance is not necessarily indicative of future results.

Corn sentiment is turning bearish - GrainStats.com CommunityCorn price sentiment is turning bearish according to the GrainStats.com community. They have been bullish for the past 6 months and have been right. The question is if the bear trend is here to stay and will it continue into the harvest months. Time will tell, until then a crop still needs to be made for bears to capitalize on bearish positions.

Will Corn Hold the Early Morning Strength?Grain futures came out of the gates strong last night but are retreating as weather forecasts continue to change. This is to be expected this time of year. There is a USDA report tomorrow, but weather forecasts this week will likely have a bigger impact on prices. We will have estimates out later this afternoon.
Corn
Commitments of Traders Update: Friday’s CoT report showed Managed Money were net sellers of 55,748 futures/options contracts through July 5th. 30,446 was long liquidation and 25,302 were new shorts. This shrinks the net long position to 172,867 futures/options. Broken down, that is 244,288 longs VS 71,421 shorts. This is the smallest position they’ve held since October 2020. If you’re new to grain trading, you may think that funds nearly always hold a net long position (like they do in live cattle). That couldn’t be further from the truth.
Technicals: Corn futures were 16 cents higher last week and are taking on another 16+ cents on in the Sunday night/Monday morning trade. Early last week we moved our bias from Bearish territory to Bullish territory, siting significant support levels and an extreme low in the RSI. Alone, those are not enough to outright flip our bias, but together it was. The market gaped higher to start this week’s trade. This has taken prices back to the secondary breakdown point from June 30th, near 650. Last week we talked about this area being a potential selling opportunity for those who exited shorts or initiated longs against support last week. That thesis is still in play, moving our bias back into Bearish territory.
Bias: Neutral/Bearish
Previous Session Bias: Neutral/Bullish
Resistance: 667**, 678 ¼-684 ½**, 697-701****
Pivot: 645-652 ½
Support: 624-630***, 586-589****, 574 ¼-579 ¼***
Futures trading involves substantial risk of loss and may not be suitable for all investors. Trading advice is based on information taken from trade and statistical services and other sources Blue Line Futures, LLC believes are reliable. We do not guarantee that such information is accurate or complete and it should not be relied upon as such. Trading advice reflects our good faith judgment at a specific time and is subject to change without notice. There is no guarantee that the advice we give will result in profitable trades. All trading decisions will be made by the account holder. Past performance is not necessarily indicative of future results.

CORN FUTURES SELL CALL OUT BY JOHN THE FOREX GUY!NB Watch the video I published on corn sell I explained my trade in more details.
I will give you an IDEA/EXAMPLE how I am taking this trade lets base this on a $100 account:
(A) Open 1x position SELL
(B) Stop loss -$5.50 (5.5% loss of $100)
(C) Take profit +$25.00(25% profit of $100)
Disclaimer I not a financial advisor I am simply a retail trader sharing my trade where I entered, plan to exit loss and profit so always do your own research before committing/investing your money.

Time to Buy the Dip?
Corn
Seasonal Trends in Play: Short September corn from 6/13-7/27. This has been profitable for 13 of the last 15 years with the average gain being roughly 33 cents, or $1,650 per one 5,000-bushel contract.
Fundamentals: Yesterday's weekly Crop Progress report showed good/excellent conditions at 64%, this is a 3% drop from last week and 1% lower than expectations. Compared to last year, that number is unchanged. 7% of the crop is silking. Weekly export inspections came in at 676,824 metric tons, well below the range of estimates.
Technicals: Corn futures broke below support which opened the door for a precipitous drop, filling the gap from February 7th and coming within a stone's through of previously significant resistance from November to February. Despite the extreme volatility, all the technicals remain intact as our first support pocket held on a closing basis yesterday. As mentioned in yesterday's Tech Talk, this is a great risk/reward setup for those that want to be long the market. If you had been playing the seasonal bearish trend, this is the spot to consider reducing that exposure. The chart is a technical graveyard but is ripe for a decent relief rally.
Bias: Neutral/Bullish
Previous Session Bias: Neutral/Bearish
Resistance: 645-652 ½****, 678 ¼-684 ½**, 697-701****
Pivot: 624-630
Support: 586-589 ¼****, 574 ¼-579 ¼***
Futures trading involves substantial risk of loss and may not be suitable for all investors. Trading advice is based on information taken from trade and statistical services and other sources Blue Line Futures, LLC believes are reliable. We do not guarantee that such information is accurate or complete and it should not be relied upon as such. Trading advice reflects our good faith judgment at a specific time and is subject to change without notice. There is no guarantee that the advice we give will result in profitable trades. All trading decisions will be made by the account holder. Past performance is not necessarily indicative of future results.

December Corn is at Trendline SupportThis trendline was drawn a while back, when price was nowhere it and pricing being anywhere near it at this time seemed unlikely. Long here might make sense.

Corn: Continued Long Liquidation Corn
Commitments of Traders Update: Friday’s CoT report showed Managed Money were net sellers of 36,649 futures/options contracts through June 28th. This was all long liquidation, 38,185 contracts, with a tiny bit of short covering. This shrinks their net long position to 228,612 futures/options.
Seasonal Trends in Play: Short September corn from 6/13-7/27. This has been profitable for 13 of the last 15 years with the average gain being roughly 33 cents, or $1,650 per one 5,000-bushel contract.
Fundamentals: Scattered showers over the weekend have many traders looking for a lower open in the corn market. Stone X (one of the multiple FCM’s we use) raised their Brazilian crop estimate to 119.3mmt, up from 116.8mmt.
Technicals: Corn futures broke lower on Thursday, trading to the 200-day moving average. On Friday, that gave way. If the Bulls fail to reclaim ground above 630, we could see the long liquidation continues. The RSI has not showed signs of being this oversold since the spring of 2020. If the Bulls can climb back above that pocket, we could see a retracement of the breakdown from Thursday, closer to 645-652 ½.
Bias: Neutral/Bearish
Previous Session Bias: Neutral/Bearish
Resistance: 645-652 ½****, 678 ¼-684 ½**, 697-701****
Pivot: 624-630
Support: 586-589 ¼****, 574 ¼-579 ¼***
Futures trading involves substantial risk of loss and may not be suitable for all investors. Trading advice is based on information taken from trade and statistical services and other sources Blue Line Futures, LLC believes are reliable. We do not guarantee that such information is accurate or complete and it should not be relied upon as such. Trading advice reflects our good faith judgment at a specific time and is subject to change without notice. There is no guarantee that the advice we give will result in profitable trades. All trading decisions will be made by the account holder. Past performance is not necessarily indicative of future results.

Continuous Corn - WeeklyContinuous Corn - Weekly: **The big red bar down this week is a bit exaggerated as this chart has rolled to chart against the Sep with a 1.20+ inverse. Nonetheless, corn is still down .50 +/- for the week. The 6.16 low hit the trendline, time will tell if this holds. Should we see a bounce from here the first test will be at 7.05 to 7.20. Primary targeted area at 7.72 to 8.00. Extended potential above 8.24 at the 8.50 area. IMO, we will need the reality of production cuts to see new highs, not just a weather forecast.

Corn: Pitch forks at playContinuous Corn – Weekly: Up trending vs Down trending Pitchforks – Continued from 6/2/22…
Up until two weeks ago it appeared that cash corn was going to follow the green bars up with the up trending pitchfork. The July/Sep inverse was a big challenge and the move lower just killed the chance for the continuous chart to maintain upward momentum. Currently the Sep corn leading the continuous chart and is looking for support against the median line in the 6.00 to 6.08 area. If we can catch a bounce look for resistance against the lower level blue line up into the upper level red line. Retracements in the 7.00 to 7.50 area will match up against the pitchfork resistance zones.
Below the median line offers support around the 5.45 area

Corn Futures Test the 200 Day Moving AverageCorn
Seasonal Trends in Play: Short September corn from 6/13-7/27. This has been profitable for 13 of the last 15 years with the average gain being roughly 33 cents, or $1,650 per one 5,000-bushel contract.
Technicals (September): Yesterday’s USDA report was Neutral, but Neutral wasn’t enough to feed the Bull into the last trading day of the month/quarter, which triggered additional long liquidation on a break below support from 645-652 ½. That weakness carried into the overnight session and took prices a notch below our next support pocket, 624-630. The market is now the most oversold sense April of 2020. If the market is able to defend support, we could see a retracement of yesterday’s breakdown point, 645-652 ½, this will now act as significant resistance.
Bias: Neutral/Bearish
Previous Session Bias: Neutral/Bearish
Resistance: 645-652 ½****, 678 ¼-684 ½**, 697-701****
Support: 624-630****, 589 ¼***
Futures trading involves substantial risk of loss and may not be suitable for all investors. Trading advice is based on information taken from trade and statistical services and other sources Blue Line Futures, LLC believes are reliable. We do not guarantee that such information is accurate or complete and it should not be relied upon as such. Trading advice reflects our good faith judgment at a specific time and is subject to change without notice. There is no guarantee that the advice we give will result in profitable trades. All trading decisions will be made by the account holder. Past performance is not necessarily indicative of future results.

Is Corn Done?Will be corn high by 4 of July SHeeSH. Corn really looks topped out here on the monthly
