TGCN1! trade ideas

ZC Coiling up for next moveAfter this week's WASDE report, ZC limited up on 1/12. After the expected retracement, ZC has been trading in a range from 527-537.
POC is located at 534, I am expecting a retest of the high of 541'4 in the coming weeks. However, any break below 522'0 would indicate short term weakness.
Long term target of 560'0 by early Spring.

Current Corn StructureTop: Monthly Corn (2012-Present) Green box illustrates the current Harvest rally. Currently Corn is up 63% from its August Low, matching the 03/04 rally.
The next target above at the 38% retracement of 5.07. **06/07 and 07/08 rallies illustrated above**
Middle: US Dollar- US Dollar is trending lower, but the path forward is up for much debate. Higher or Lower???
Bottom : COT / Funds & Commercials – The Funds are Long and the Commercials are Short. We rarley see the Commercials this short In a strong carry market with an abundant supply, especially this time of year. The 03/04 market had the commercials eventually lifting their shorts and followed up with the next couple of years trading in the range that precluded the 03/04 rally. The 07/08 rally kicked off a multi year bull market. Funds long and Commercials remained Short…
Upside is unmeasurable, but Bulls proceed with caution. The first run out of a multi year bear, usually isn’t as strong as the later years in a multi year bull.

Continuous Corn Then to NowTop: Monthly Corn - Green boxes illustrate Harvest rallies from Aug into the next year. The dark green boxes below represent the end of each rally. Strength of rally’s depend on strengh or weakness of dollar and money flows from the funds and (more importantly) hedge activity from the commercials.
Middle: US Dollar- Strong $ discourages a healthy US export market. Slows demand. Weak dollar strengthens the grain markets
Bottom : COT / Funds & Commercials – Weak dollar spurs export demand. Demand creates volatility & higher prices. All of which work together to engage the producers selling. The commercials buy the physical (offsetting with short hedges), and the speculators riding the waves. At times the commercials get caught with sudden strong demand or short crop. Commercials can remain short for extended periods until the next supply build. Funds stay Long

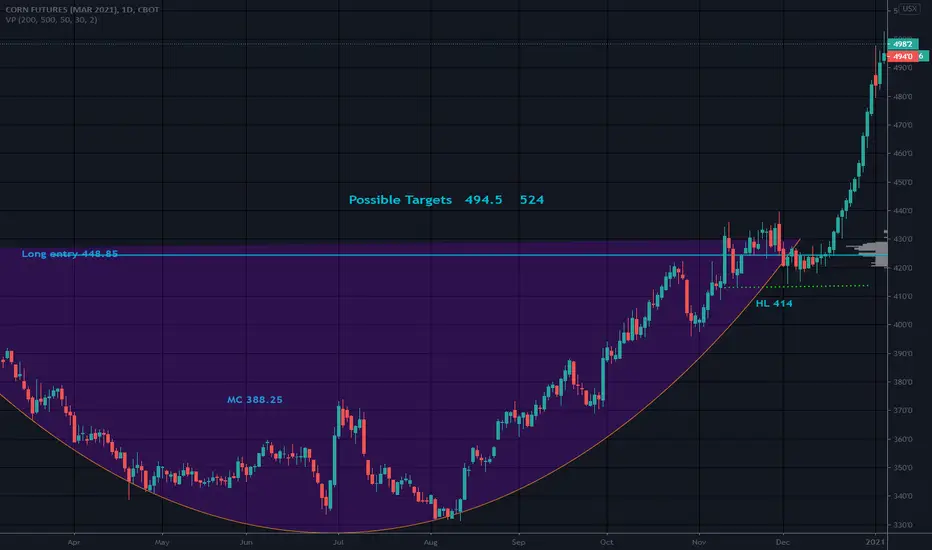
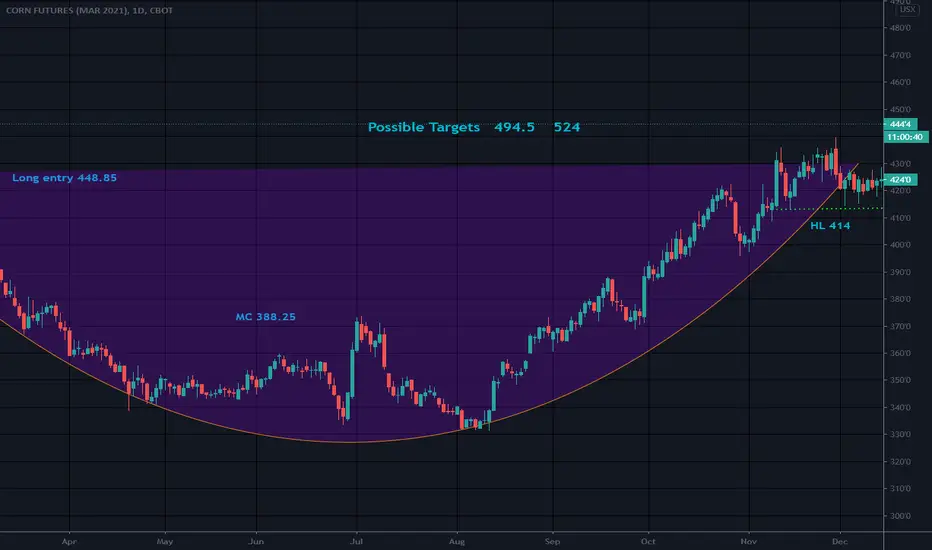
Cup and HandleContract March 2021
Not a recommendation and looking a bit steep!
Target 2: 524 to 544
After pullback, long ZCStrong technical upward trend last few weeks on ZC which broke price levels not seen since 2014. Expect some volatility going into next week's WASDE report on 1/12/21. From a fundamental side, current La Nina weather pattern in the Pacific could impact South American crop production.
After a pullback, I am anticipating this trend to continue. Targeting mid to upper 500's by February/March.

Corn futures ZC - EW analysis - Buy after correction Corn futures - ZC - It is in extended 3rd of C wave up. Currently expecting sharp abc of 4th subwave correction of 3rd wave, which will go higher after completion to end the 3rd of C wave up.
Give thumbs up if you really like the trade idea.


CORN breakout pattern tradeCBOT_MINI:XC1!
Here is an example of a double bottom breakout trade of CORN I made in September. As you can see there was a nice confirmation of volume and also the fundamentals were in sync.


Cup and HandleMarch 2021 contract
Possible stop below HL (Handle low) or mid cup which is 388.3
Not a recommendation
Corn futures ZC - EW analysis - Buy after correction Corn futures - ZC - It is about to finish the 3rd of C wave up and expecting correction thereafter as sharp down. Buy the correction near 431 level for higher high as target above 455 as final move up of C wave.
Give thumbs up if you really like the trade idea.

Corn FuturesWould this not be fun if we had nice little cup and handle that ended in a new high support?!?!?

ZC1!Corn back above key support/resistance line this morning. Will watch to see if it can hold into the close today


Cup and HandleMarch 2021
Pattern only valid at or above long entry level..
Support below handle low (HL) or mid cup (MC)
Not a recommendation

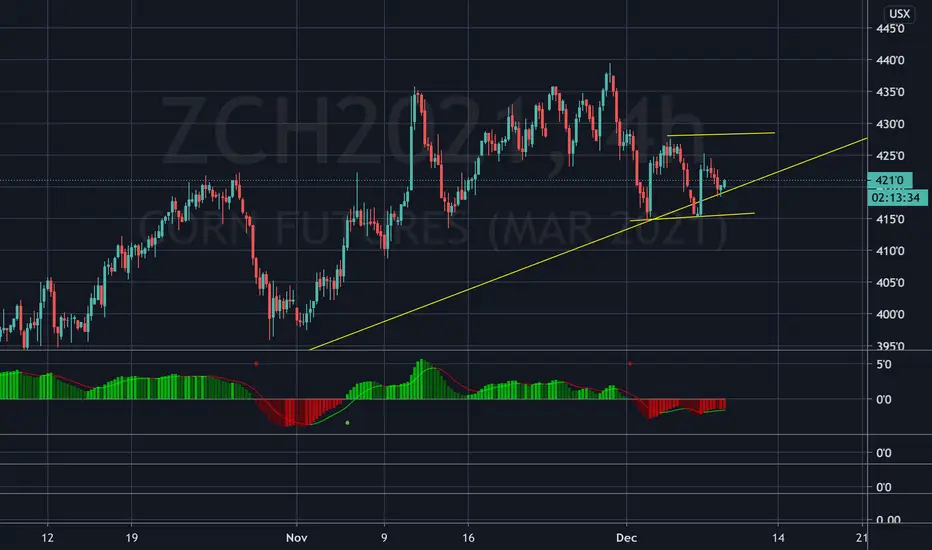
Long C H1 as it is both bullish in FA & TACorn continues to trade along the lower end of the trend channel. Both daily and weeklies are still on the uptrend but watch carefully as some of the momentum indicators continue to flatten.
On the fundamental side, erratic weather patterns in South America and continuous large demand from the Chinese continue the bullish case for the corn and the grains complex. My initial TP on the trade is around 4.50 for starters, entry is 4.25, and stop loss level is set at 4.20. Thinking of an R-Multiple of 5. Though as soon as the trade goes my way, will lift my stops to breakeven.

Brazilian Corn.. indecisionFor moment brazilian corn has given a break on it trends up.... now its moment to take profits and walk away waiting for moment


Three Drives pattern. Trend slowing/changing?I have Adam Grimes book I have been reading and I went back to look because I saw this similar on a daily trade he wrote about on wheat. I'm also considering the 100 month moving average and the fact that were at highs of a big range from 2014 on corn. Currently parabolic on the Daily. I'm expecting a trend change to follow oats and wheat. This pattern as far as the Daily is known as a Three Drives Pattern.

small short, tight SLi didn't look at fundamentals, so i'm taking small short position was tight stop loss
