TGCN1! trade ideas

hurry up ..... guys do not miss it !!!!!!the corn starting an up trend the price will go to red zone and the will broke it and will do support in it and the price will go higher and higher


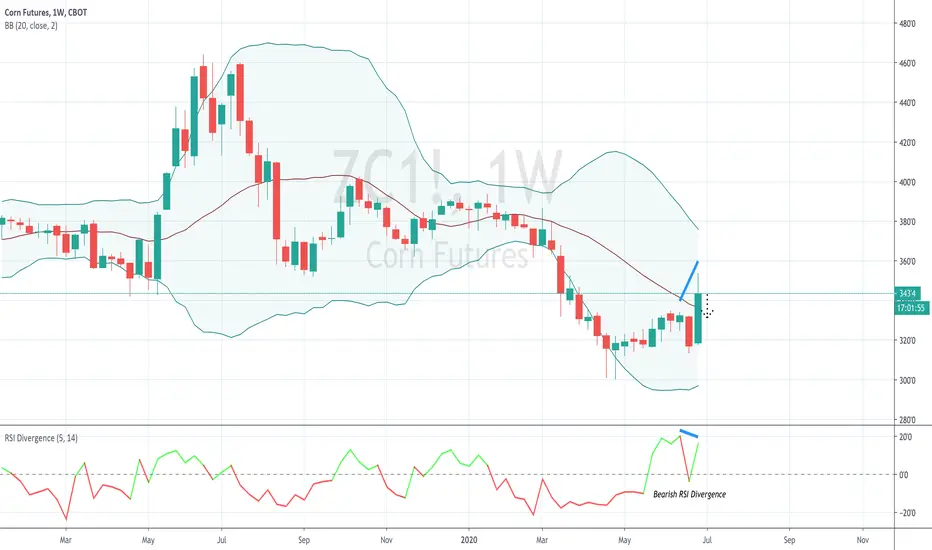
ZC bottom of the range on the monthlyUsing the linear regression trend tool, you can see that we're at the bottom of the range going back to 2014.


BUY: 2 First higher swing low on Corn after Double BottomFirst higher swing low on 2 day swing chart after a weekly double bottom indicating a possible minor target of 362.

CZ - LONGI hate to buck the LT trend but I think the LT reversal maybe upon us. So much injection of $$ inflation can not be held to nothing forever. Its coming, and probably already here.


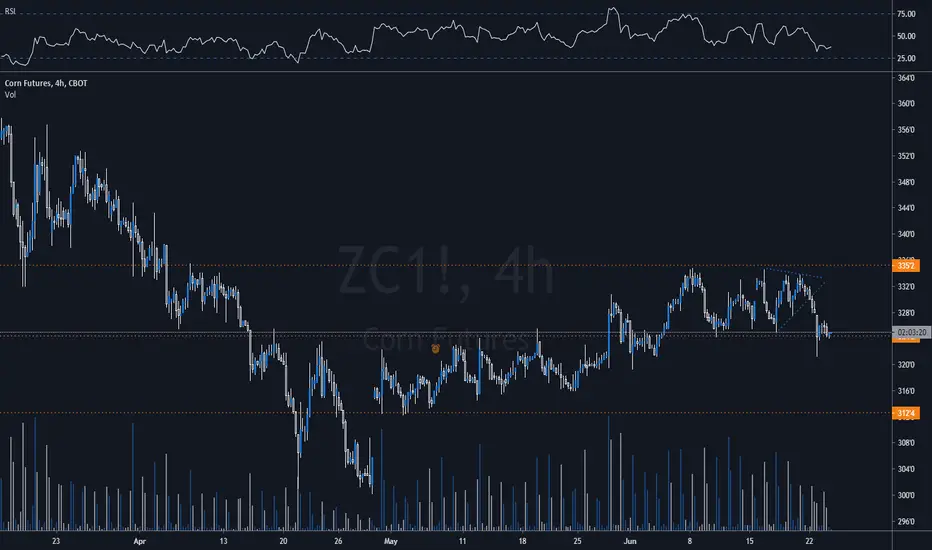
Corn (ZC) offers more entry points
Those who track my weekly trading journal know that recently Corn offered an amazing long-term long opportunity with the price being at the bottom of a 5-year channel . Since May 17, we increased the position and partially closed it last week. Now, after a retracement, we saw last week, new entry points emerge.
Before I continue, please note that I do hold ZCU-20 contract. As always, please note that this analysis is my point of view, and trading is a risky activity. You are the only responsible for your trading actions. Now, with disclaimers being said, let's take a look at the trade.
So, getting back to Corn. Two months ago the price was near the lowest border of a 5-year channel, which spreads from 310 to 440. Besides, the net position of producers in the CoT reports hit the max value of the last 3 years. In other words, the possibility of an upward movement was pretty high.
Since it's a really long-term position, there will be plenty of new entries. The last entry we had was on June 26. Now we have another one. During the last week, the price plunged and approached 50-period daily MA. Today, the early futures activities made a possible hammer, which may be a good long-entry point. However, since this candle pattern formed with low accompanied volume, it may be unreliable. For now, I suggest waiting for the pre-market session and consider an increase in the long position in case the open price won't be less than the 330.
P.S. Check-out our free educational platform Sharepdge Academy at sharpedge.academy . There, you can find many valuable courses, videos, articles, and researches.

CORN MINI DAILY ANALYSISHi friends
the daily graph of this market shows that it will experience a bearish trend in the coming days but we must take into consideration the change in the direction of the market towards the opposite
please subscribe to receive new analyzes


XC2! , DXY - Corn of course I was poking around and found this correlation.The size is much larger than February 28th.


patterns and wavescorn spiking off the report and Im looking to take a run at the short side for a slide under 3.00..... (348-358 is the sell setup for me) , almost got there lets see if we can hit. july has a chance but most likely be in sept ." not a reccomendation " I have no idea where we may or may not go

Corn Futures (Dec 2020 contract) Cup and Handle on DailyA cup and handle pattern appears on this chart which suggests an upside breakout will occur in the near future.
Best case: Breakout from here
2nd best case: Handle gets a little bit longer then breaks out
Bad case: Handle gets a lot longer to the point where the cup and handle pattern no longer looks like a cup and handle, suggesting an upside breakout may not take place.
Worst case: Obviously, it can drop from here and be a failed cup and handle. No patterns are guaranteed predictors of the future.

Corn 6/25 Recap Corn breaking a range today with CN down to 317-2, way off the session highs. Weather pointing to a good start: dryer spots like Dakotas getting some rain. Outside markets also helping to push prices lower. Some supply estimates also point to YoY growth for production (Ukraine showing a 4M ton increase for 2020). Dec made a new contract low and momentum continuing to point lower.

Corn shortThe breakout level of the last breakout move has beed broken, so I go short, stop on the last peak, RR is quite nice.