TGCN1! trade ideas


Corn Bullish FlagMay Corn created a bullish flag today. Waiting for confirmation tonight and into tomorrow. Corn hasn't made complete 78.2 fall, but this may be as low as corn goes for the moment for a retrace. Flag has both candles pretty close to the same size which is a good sign. Also looking for start of corn in around mid of flag. Upside target 368'4

Corn CrashedCorn is setting up a bullish Gartley pattern. Went below two uptrend lines and stayed below. Bearish Thursday USDA report may see continued drop to 357'4.

Corn looking bearish...Hello all
Just a quick post on corn. Not showing weekly chart here . But weekly is at resistance. Daly is in 7 month long channel and there is trendline there too. looks like it attempted to break it. I will be watching this closely . Any spike higher towards kijun and failure is swing sell targetting previous lows. Let's see how this plays out.
Good luck everyone.

Bearish Corn on USDA reportMay Corn fell further today. Came to trend line. USDA report bearish. Looking for Corn to break trend in the next day or two. Projected Gartley to 357'4

Corn Bullish FlagMay Corn produced a bullish flag today. Upside target 387'2 for triple top with possible continuation to 391'4 at Cypher C position and possible extension into 396 area. Support at 376'4

Update on Corn Futures: retrace, then next leg upThis is a follow up on this forecast:
Still bullish on Corn, after a surge up price retraced.
At this moment Corn is still in that retrace, but expect the next leg up soon.

CBoT corn dailyThe daily MAY17 chart shows that price has been under influence of a solid horizontal resistance line at around the 375 level since October 2016. Price managed to break same resistance on February 7 from where price traded up to 385 until price made a reverse and started trading down towards same 375 level which now serves as support. During the last 2 sessions of last week price actually pierced through same supportive value. However, the green triangle that has been put into chart represents a strong supportive zone which comes from the horizontal trend line at around the 375 level and the ascending trend line which represents the lower boundary of the ascending price channel.
Friday’s candle in the shape of a so-called ‘Hammer’ suggests that the end of the decline of the past 6 sessions is now imminent and that price will find a bottom here. We will allow price one or two more down sessions towards the 363 level before we will consider an alternative short term outlook for this price.

CBoT corn weeklyThe weekly continuation chart shows a very solid bottom at around 320 and an equally very solid top at around 440. Price has been trading sideways between these values since June 2014 and these values are relevant for us to keep in our minds.
From August 2016 on price gradually moved higher from its solid long term supportive level, gradually making higher highs and higher lows.
Within the 320/440 trading range there is a trending ascending channel that starts in August 2016 at 320 and gradually moves up. The ascending resistance of this trending price channel is at around 395 for the coming week and its ascending support is at 360 for the coming week. These supportive and resistance lines are to be kept in mind when looking at the price for the medium/long term. Until proven the contrary we have to assume that price will continue developing within this ascending price channel. Price could well make one more move down for the week to come but we keep our target at the upper boundaries of the ascending channel.

CornMay Corn fell off a bearish flag. Friday may bring mixed trading and possibly lower. USDA reports suggest a lot of corn still available along with South America huge crops. Corn may have a struggle going higher short term.

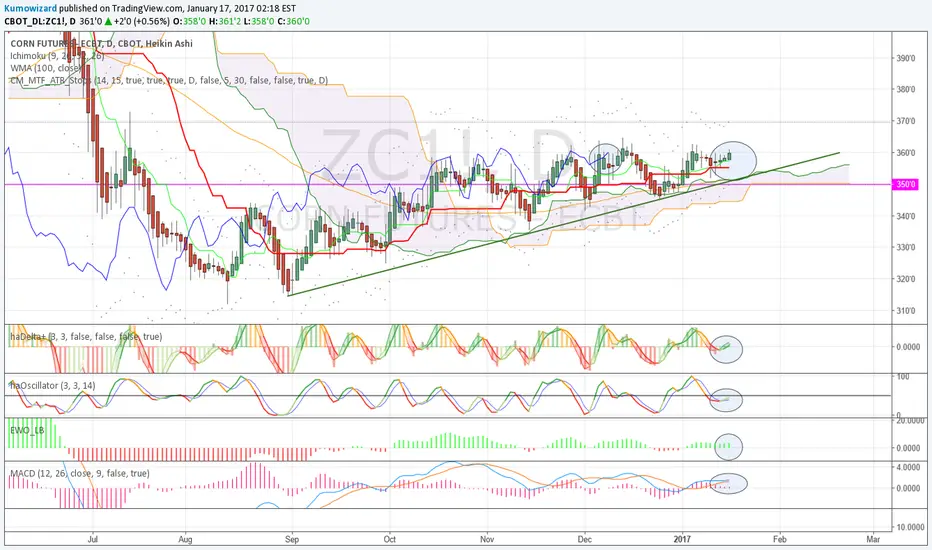
Look for a buy signal at 369-372 support! $ZC- Price is back to key support marked by Kijun and horizontal line
- trend is bullish, Ichimoku setup is bullish
- Heikin-Ashi shows pull back, but watch out for haDelta+ and haOscillator! Both started to bottom out.
- EWO is bullish
- MACD is in bullish zone, have not crossed down.
Until we have bullish setup, we only look for buy signals at supports. Let's see what Heikin-Ashi tells us in coming days around 369-372.
Corn reversed courseMay Corn dropped last night and came back today. Corn acreage estimates down a little from last year. Possible come back for Corn from here to attempt a double top.

Corn Fall off of ButterflyCorn has fallen off of the Bearish Butterfly. It rose into the extension. Estimators put corn acreage at 90.48 million vs 2016’s 94 million. This should support an rise again on corn. New Butterfly projection fall to 61.8-78.6, then possible rise to a double top or beyond.

CBoT cornThe daily shows a short term heavy vertical resistance zone at around the 365/370 level where price started bumping into during mid October 2017 and a heavy horizontal supportive zone at around the 340/345 level. We clearly see on the chart that price has been testing the resistance level at least 8 times since October 2016 and that price is now in its 9th attempt after the last try did not quite succeed.
The EW count (not displayed on the chart) suggests that price is now in for a wave 3 of (3) of circled 3 which should give price the boost to definitely break the 365/370 resistance level and let price trade to the 400/425 level where we find the previous high of June 2016.

Forecast Corn Futures: Move up 385This is an update on a earlier forecast on corn futures.
The analysis remains the same: expect a move up to 385, then a retrace.

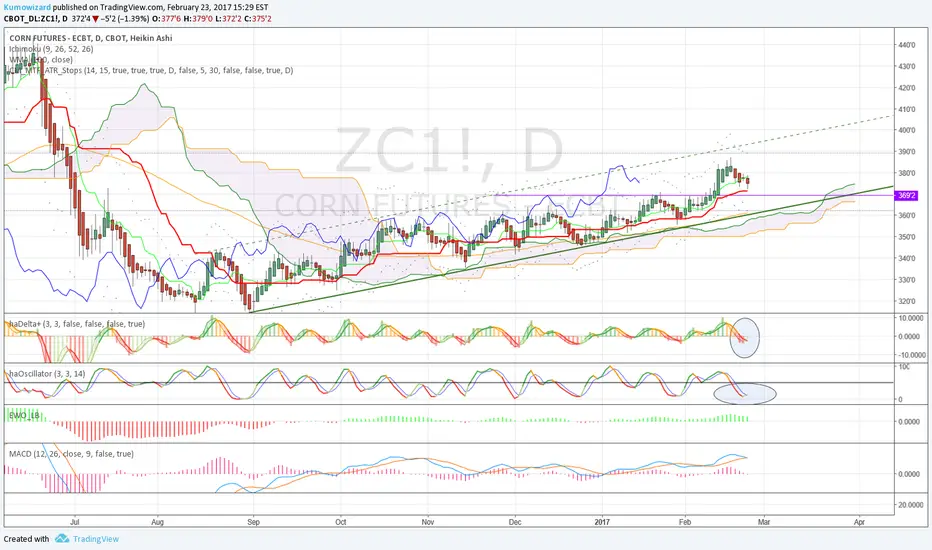
Back to Kijun support. Watch for next buy signal!Watch price action at Kijun, Kumo and 100wma supports in coming days. Don't hesitate to buy Corn again, whenever you see a firm buy signal!
Should you enter a long, based on my system rules initial stop should be placed at 349.
Note: volatility is still extreme low in Corn. Pls see ATR below.

CornMay Corn fought back after Trump called the president of Mexico to ease tensions after tweets. This market is above the 20 day moving average. Last 3 candles are rejecting lower prices. Mexico is a large buyer of US Corn, so if these talks falter, Corn may continue downward.
We could also be looking at a head and shoulders pattern. Neckline coming in at 360'6 support from back in September. Possible trade down to 78.6% area to build out the other shoulder.
Lastly, an Elliot Wave is here (plotting will just make this chart even more busy). Leg 4 has completed and the last leg up would complete the butterfly. A lot going on for just one market.

Milho para 2017: plantar para colher!Os gráficos dos futuros de milho me chamam atenção pela simetria e repetição de certos padrões. O ciclo básico que identifiquei dura 14 meses, durante os quais o movimento original realiza uma retração de 100% e marca um pivô de baixa na retração de 38.2%
A zona entre R$ 34-35 foi o topo de 2012, 2013 e 2014, rompido em 2015 e agora sendo retestado, com correção tanto no preço quanto no tempo (14 meses). Fechando com uma sombra no mensal é um belo indicativo de que as posições estão sendo montadas nessa zona.
Estou montando minha posição no CCMU2017, nos contratos para outubro o nível equivalente a R$ 34 nesta análise é R$ 30,50 (topo ou pivô importante em CCMU2015, CCMU2014 e CCMU2013), que foi testado e rejeitado nos últimos dias.
Alvo 1: R$ 39-40 (março-abril)
Retração de 38% da perna de baixa
Teste da MME9
Pivô de baixa
Alvo 2: R$ 44 (setembro-outubro)
Retração de 61.8%
Pivô de baixa

Expect Corn to run up in the coming weeksExpect Corn (Futures) to run up between January and March 2017.

CORN | Weekly ChartIt's arguably a similar case to the former on wheat... Buying within the lowest decile in a decade, a very asymmetric return distribution, a potential break-out of the down trend.


Bullish bias. What else do we need?Ichimoku setup -> Bullish:
- price above Kumo and Kijun
- Forward Kumo bullish
- Tenkan/Kijun bullish
- Chikou Span is about to cross above past candles. This is what we need for final confirmation, and then price action would also push all average lines pointing up
Heikin-Ashi -> Bullish
EWO -> Bullish
MACD -> Bullish
What else do we need for a leveraged long position? Some momentum gain, which would come with a confirmation close above 362!
(Note: Stop for my initial long position is trailed to 350)