TGCN1! trade ideas


CORN Deflation.!Weekly short target. Might go lower.
Some problem is current El Nino there might give some volatility before target hit.!


If 347-350 holds... decision time soon: key 372+Weekly:
- Range extremely tight now! Major bearish tremdline on top side ard 372, horizontal resistance and possible bullish channel on the lower side ard 345-350
- If price breaks above 372, we could see a big short squeeze
- Heikin-Ashi shows undecision, but with positive divergnece in weekly haDelta
Daily:
- Spike again from key resistance of 347-350, but Ichimoku setup is still bearish.
- Trendline, Kijun, Kumo and 100 WMA has to be broken for further gains. However if Price breaks 368-372, that will be a very strong indication for more Bullish action, in line with the weekly chart! It would be similar to the one we saw last July!
- Heikin Ashi early signal for reversal
Strategy: Hold small long, and do not be shy to leverage up bullish position if you see 372 breaking!

King Corn false breakoutNo bottom in site. Break of 347 confirms. Break back above current T/L at 370 suggests signs of reversal.

Corn Long Term IdeaCorn, shows them in his past aggressiveness very agitated and violent movements, and possibly in future also this is his behavior, reacion, added to it, it is clearly a cone shape, taking into whether the price, and giving its characteristic shape, plus you can see the possible formation of a huge formation type "W", which appears to have a huge reacion future.

How about some "POP" Corn?Corn is ripe for the picking and ready to POP. With glut of corn in silo's we like the downside...BUT, this can either way. Be nimble. We expect a nice 6-8 day run.


Reminder - #Corn Key levelsChart reflects to ZCH6 (March/16) contract.
Upper side:
- 381 -> Daily Kijun, Daily bearish trendline
- 401 -> Daily bullish Kumo breakout validation / Weekly and Monthly bearish trendline breaks / Monthly Tenkan Sen / Weekly Kijun Sen !
Lower side:
- Bullish reversal idea would be invalidated below 363
Price not much changed since last post. Quite firm between daily Tenkan and Kijun. Next break attempt above 381 could accelerate into a short squeeze.
Strategy: Hold 0,5 or maximum 1 risk unit long. Leverage up on firm breaks above bullish upper key levels! Stop at/below 363.

Corn update - Chance for bullish reversal improvesWeekly:
- Remarkable doji Heikin-Ashi candle now from key supp/res. The candle did not have a lower low.
Daily:
- Ichimoku setup back to neutral. Kijun Sen may be tested soon at 380!
- Heikin Ashi is firm bullish. haDelta goes higher, it shows momentum gain.
- EWO closing up to zero
Bullish acceleration is expected above 380, but the real game changer would be 400!
Can not post 4H here but I already did it on Twitter this morning.4H Ichimoku setup turned to bullish! Pull backs to 374-375 can be bought!
I increased my longs a bit yesterday.

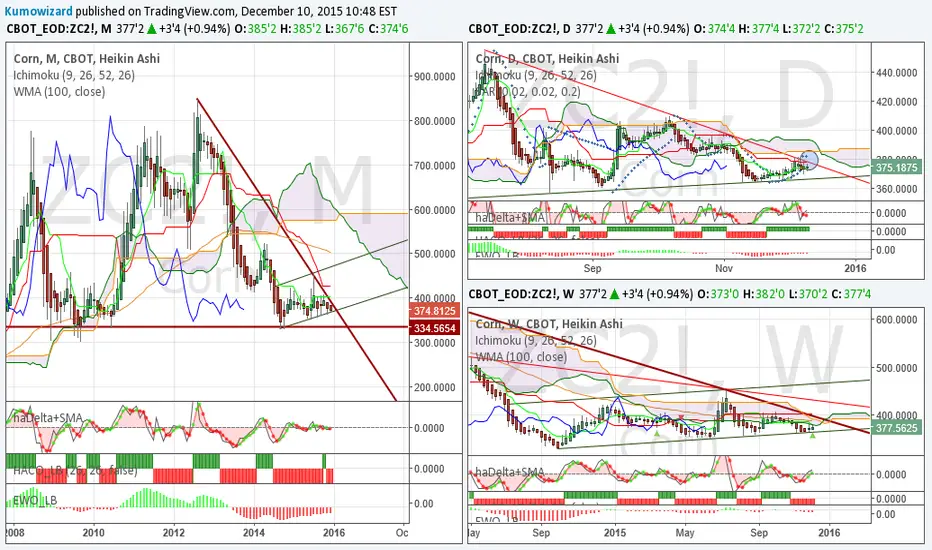
Higher low, slight bullish biasThere will be front contract change soon, so this time I place ZC2!, which refers to March/2016 contract.
Weekly:
- After testing Kumo, in last 6 weeks price dropped below cloud, but again it looks like printing only a higher low. Channel support held for last 2 weeks. Ichimoku setup can not gain bearish momentum until price trades above 353.
- Heikin Ashi started to signal possible slow down in bearish momentum. Consolidation in progress, which may turn into a pull back this week or next.
- Weekly key reversal levels: 390-400 area and 425 above Kumo.
Daily:
- Ichimoku started to turn back to neutral. Price made its higher low on 17/Nov, since then it is ticking up. First key level is 380+
- Heikin Ashi made a long wicked doji yesterday. It looks like there was a larger buyer in corn market, and price failed to reverse bearish again. Today candle is bullish, confirmed by haDelta above zero and oscillator in green.
Strategy: hold 0,5 unit long.

Will 355-360 key support hold again? - Update with weekly chartWeekly:
- Ichimoku setup is neutral with bearish biased, but asbias. Mkt have been missing real bearish momentum in 2015, Kumo was tested couple of times and forward Kumo has become thin and flat: will be easier to break through in case if a reversal.
- Major bearish trendline is close with its appr. 396 value. Against this we have a shorter term bullish trend channel, with support at 355-360 range. Market is stuck between these support resistance levels. Bears would need a massive break below 355, while Bulls could take a startegic lead really above 400
- Heikin Ashi candle is bearish, but smoothed haDelta shows losing momentum again. If we close the week higher from current spot price, then weekly candle will have a higher low.
- EWO has minor bearish bias, but vitually almost at zero: market doesn't have a trend wave, just range consolidation.
Daily:
- Ichimoku setup has bearish bias, but for validation Price should break prev low (resistance) at 355.
- Heikin Ashi signalled drop in selling interest in last two days as Price approached 355-360 zone. Heikin Ashi candle turns small green, with smoothed haDelta trying to move back above zero line.
- There is some chance for a pull back to 373 key level. For a bullish reversal Price has to close above 380
I still think the chance of a strategic bullish reversal is slowly increasing. First 355 should hold as firm support, then the upper key levels have to be cleared at 380 and 400.
Who knows what El Nino brings us next year...
Note: I keep small long for now as swing trade.

Slight bullish bias in the neutral zoneWeekly:
- Ichimoku setup is neutral
- Heikin Ashi setup is neutral, with some minor bullish bias -> haDelta crosses above SMA3, but it is still ard zero line, so no momentum gain yet.
- Within a few weeks time Pice can get to a very important long term supp/res level: 396+
Long term bearish trendline, Kijun Sen (26 weeks average), future Senkou B (52 weeks average)
- Market has been developing a possible bullish channel since Sept/2014 lows.
- Lower key lvls: 373 (Tenkan) and 355+ (trend channel bottom and and horizontal lvl.
- Upper key levels: 396+ and 419+
Daily:
- This is the textbook example of the possibly most neutral Ichimoku setup: Price is in the Kumo, stays between Tenkan and Kijun. Tenkan is below Kijun, and both average lines are also in the Kumo. Senkou lines and Kijun are flat, not pointing in any direction. Even future Kumo shades over price. Obviously 373 - 385 is a neutral range.
- Heikin Ashi is bullish within the neutral range. Momentum could gain only above 385.
I'd say it is a buy on dips until stays above 373. Would be really bearish only below 355. Would be more bullish above 385 and really strategic bullish above 400!
Based on the weekly chart I have the feeling that Corn is building a longer term bottom and may reverse bullish probably next year. Of course we have to wait for price confirmation, until then it is just an idea and a feeling.
Also imprtant to note, that for a bullish reversal the whole agri complex (Wheat, Corn and Soybeans) has to move in same direction. Right now it is not yet true.
