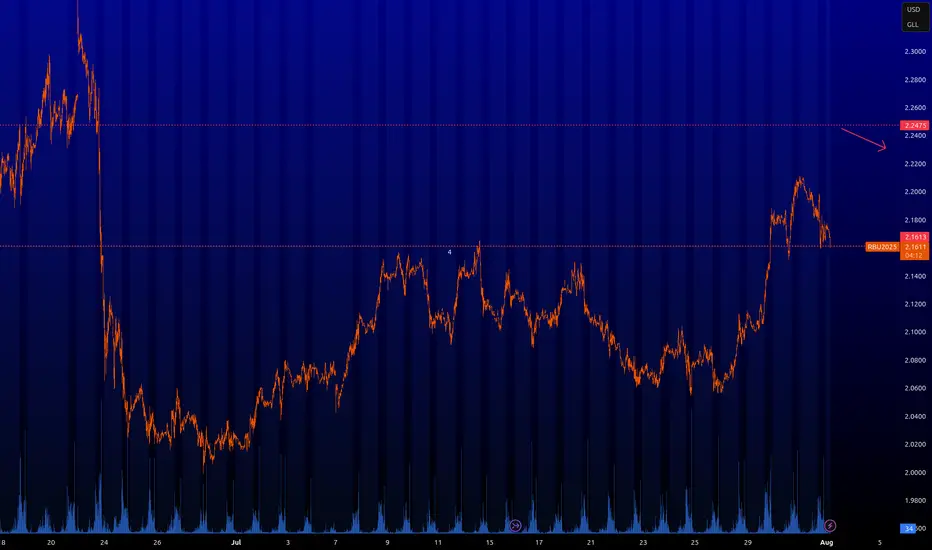
RBOB : Key levelsHere are the key levels that the market will be interested in. We can scalp from 2.2475. I have never traded this instrument, I do not know the specifics, but the level will be interesting. We can expect a bounce from it. I am more interested if it becomes inactive.
THU1! trade ideas
RB - US Gasoline Futures to Decline due to Lower ConsumptionNYMEX: RBOB Gasoline Futures ( NYMEX:RB1! )
WTI crude oil futures declined 13.4% since the beginning of the year. It dropped as much as $20 from the mid-January peak of $80 a barrel, before recovering to $64 last week.
In my commentary on February 11th, “Reversal of US Energy Policy Could Push Crude Oil Lower”, I described the main reasons behind the oil market correction:
• US oil production will rise, benefiting from the new energy policy by President Trump as “Drill Baby Drill”
• OPEC+ to increase crude oil production, ending its voluntary production cuts
• Threats of Tariffs could curtail global oil demand
First, on March 31st, the U.S. Energy Information Administration (“EIA”) reported that U.S. field production of crude oil reached 13.146 million barrels per day (mb/pd), up 592 mb/pd or +4.7% from the year-ago level. This is the highest January production level since 1920!
Second, on April 3rd, the OPEC+ members met and decided to end the voluntary production cuts, gradually bringing back 2.2 mb/pd additional supply to the oil market.
Third, Reciprocal Tariff has brought the container shipping industry to its knees. MSC, Maersk, CMA CGM, and Hapag-Lloyd, which ferry goods for retail giants like Walmart, Target, and Home Depot, have seen sharp declines in booking. The tariff uncertainty caused many importers to cancel their orders. This could cause major consequences.
According to Statista, about 71% of the items sold on Amazon were sourced from China. The procurement for Christmas-season products has already begun. Without a US-China trade deal, US consumers could expect fewer gift options at higher prices. Inflation could rebound sooner, as merchants deplete their inventory and face a supply shortage.
This could hurt gasoline demand. On the one hand, higher shopping costs cut into consumer spending budget; on the other, fewer deals at retailers discourage shoppers from taking a trip.
On April 18th, American Automotive Association (“AAA”) reported that national average price for regular gas was $3.182 per gallon, down 14% from the year-ago level.
On April 19th, RBOB gasoline futures quoted $2.0839 per gallon, up 1.8% year-to-date. This contrasts sharply with the down trends in the spot market and the oil futures market.
The April EIA Short-Term Energy Outlook (“STEO”) report states that U.S. retail price for regular gasoline averages $3.10 per gallon in its forecast for this summer (April–September), about 20 cents less than the previous forecast in March. The lower price forecast mostly reflects the expectation of lower crude oil prices. If realized, the forecast gasoline price would be the lowest inflation adjusted summer average price since 2020.
In my opinion, gasoline prices could stay relatively high during the peak summer driving season. After that, Gas prices could turn significantly lower through the end of the year.
Commitment of Traders shows bearish sentiment
The CFTC Commitments of Traders report shows that on April 15th, total Open Interest (OI) for NYMEX RBOB Futures is 418,277 contracts. “Managed Money” (i.e., hedge funds) own 52,114 in Long, 36,615 in Short and 47,628 in Spreading positions.
• While they maintain a long-short ratio of 1.4:1, hedge funds have reduced long positions by 5,198 (-9%) while increasing short positions by 6,021 (+14%).
• This indicates that “Smart Money” is becoming less bullish on gasoline.
Trade Setup with RBOB Futures
If a trader shares a similar view, he could express his opinion by shorting the NYMEX RBOB Gasoline Futures ( CSE:RB ).
RB contracts have a notional value of 42,000 gallons of gasoline oil. With Friday settlement price of $2.0149, each September contract (RBU5) has a notional value of $84,626. Buying or selling one contract requires an initial margin of $5,840.
Hypothetically, a trader shorts September RB contract and RBOB prices drop to $1.90. A short futures position would gain $4,826 (= (2.0149 – 1.90) x $42000). Using the initial margin as a cost base, a theoretical return would be +82.6% (= 4826 / 5840).
The risk of shorting gasoline futures is rising oil and gas prices. Investors could lose part of or all their initial margin. A trader could set a stop loss while establishing his short position. In the above example, the trader could set stop-loss at $2.10 when entering the short order at $2.0149. If gasoline price continues to rise, the maximum loss would be $3,574 ( = (2.10 – 2.0149) *42000).
Happy Trading.
Disclaimers
*Trade ideas cited above are for illustration only, as an integral part of a case study to demonstrate the fundamental concepts in risk management under the market scenarios being discussed. They shall not be construed as investment recommendations or advice. Nor are they used to promote any specific products, or services.
CME Real-time Market Data help identify trading set-ups and express my market views. If you have futures in your trading portfolio, you can check out on CME Group data plans available that suit your trading needs www.tradingview.com

Daily RB analysisDaily RB analysis
A long position with the target and stop loss as shown in the chart
The trend is up, we may see more upside
All the best, I hope for your participation in the analysis, and for any inquiries, please send in the comments.
He gave a signal from the strongest areas of entry, special recommendations, with a success rate of 95%, for any inquiry or request for analysis, contact me

Gasoline Inventories Fall Despite Weak DemandDeclining Gasoline Stockpiles and Market Adjustments
U.S. gasoline inventories decreased by 1.4 million barrels last week, bringing total stockpiles 1% above the five-year seasonal average. This decline occurred despite relatively weak demand growth, indicating that refiners are actively adjusting supply to prevent excessive buildup.
Over the past four weeks, gasoline consumption has averaged 8.4 million barrels per day (bpd), reflecting a modest 0.9% increase year-over-year. While this suggests a slight recovery in demand, the overall pace of consumption remains subdued compared to historical seasonal trends. Consumers have yet to show a strong rebound in gasoline purchases, possibly due to economic uncertainty, shifts in commuting patterns, or improving vehicle fuel efficiency.
Refinery Output and Pricing Trends
Refinery production of gasoline rose to 9.6 million bpd, signaling refiners' efforts to maintain a stable supply balance. Despite this, retail gasoline prices continued their downward trend, falling to $3.078 per gallon, marking a decline both on a weekly and yearly basis. The drop in prices reflects a combination of steady production levels, lower crude costs, and moderate demand growth.
While gasoline inventories are currently declining, their position above the five-year average suggests that refiners have room to adjust supply if consumption remains weak. The seasonal transition to summer-grade gasoline may introduce additional fluctuations in pricing and availability, making upcoming refinery utilization rates a key factor to monitor.
Market Outlook and Investment Considerations
Refinery stocks such as Marathon Petroleum ( NYSE:MPC ) and Phillips 66 ( NYSE:PSX ) may experience margin adjustments as gasoline demand evolves. Meanwhile, RBOB gasoline futures ( NYMEX:RB1! ) could remain under pressure unless demand picks up or crude prices provide upward momentum.
The decline in gasoline inventories, coupled with weak demand growth and falling prices, suggests a period of relative stability in the market. However, seasonal factors and refinery adjustments could introduce new price movements in the coming weeks.

RBOB Gasoline has broken the Trend-BarrierSince the TB is broken, we go a little sideways. Looks like someone is loading the Boat.
However, if we break the red resistance, chances are very good we start to move to the North.
To me this looks like a fantastic Risk/Reward.
So, if it looks like a valid Trade, and it smells and behave like one, it probably IS one I should take.
Let's stalk this for a break of Resistance.

GASOLINE Huge rebound expected on the 1D MA50.Gasoline (RB1!) is on a corrective sequence in the past 2 weeks as it got rejected on the 1D MA200 (orange trend-line) and is about to test the 1D MA50 (blue trend-line) as Support.
Having a previously overbought 1D RSI (>70.00), this pull-back is similar to January 29 - February 02 2024. The buy signal will be given once the price breaks above the 1D MA200.
Since the previous fractal peaked marginally above the 0.786 Fibonacci retracement level, we will target this time marginally below it at 2.600.
-------------------------------------------------------------------------------
** Please LIKE 👍, FOLLOW ✅, SHARE 🙌 and COMMENT ✍ if you enjoy this idea! Also share your ideas and charts in the comments section below! This is best way to keep it relevant, support us, keep the content here free and allow the idea to reach as many people as possible. **
-------------------------------------------------------------------------------
💸💸💸💸💸💸
👇 👇 👇 👇 👇 👇

Gasoline - Continuing the up-trend as following!Hi guys , we are looking into today RBOB or Gasoline, the price formulated an amazing up-trend since we last posted about it, so we are looking to re-test the upper levels again.
After the price consolidates around the 2.19-2.20 mark we will analyse again and see what would be the next move!
Entry: 2.12
Target: 2.15
Target: 2.19
As always my friends happy trading!
P.S. If you have questions or inquiries about one of my existing set-ups or personal questions / 1 on 1 sessions consider joining my community so you can follow up with me in private!

RBOB post tariff structure and range to take advantage of!Hi guys today we are starting off with RBOB , which has been quiet for the past month and it has been trading in a structured range between 2.05 as a high resistance and 1.92 / 1.94 as strong support. As of today we are currently sitting at the given support line of 1.92 and the latest news which came from President Trump that he will impose tariffs on Canadian and Mexican Imports , which would probably impact and touch the Oil Industry. The U.S. imports 4M barrels of Crude Oil every single day from Canada and around 900-1M barrels of Oil Crude Oil from Mexico. These tariffs would definitely touch the consumer as a long term which would give us a boost into the overall demand / supply play around the prices of Petroleum Products.
Current entry RBOB (Gasoline)
1.9300 entry level, with two separate targets.
Target 1: 1.9755
Target 2: 2.0310
The strategy can be repeated after the targets are touched with a patient retracement of the lower support line and input similar targets.

Gasoline, is more likely to bottom soon. GASOLINE / 1D
Hello Traders, welcome back to another market breakdown.
GASOLINE appears to be attempting to establish another low. A breakout above critical resistance levels could indicate a potential continuation of the upward trend. However, the price is currently consolidating within a range. Therefore, rather than entering at the current levels, it is advisable to wait for a breakout followed by a pullback into the breakout zone for a more calculated and strategic entry.
Maintain discipline, allow the market to align with your strategy, and approach trades with confidence.
Trade safely,
Trader Leo.

GASOLINE sits 4 straight months on the Support. Expect reboundGasoline (RB1!) has been trading on the 4-year Support Zone for 4 straight months, forming a confirmed technical bottom. The September 09 Low was also on the Lower Lows of the long-term Falling Wedge, which makes the probabilities of a rebound even stronger.
At the same time, the 1W RSI bounced from oversold territory (below 30.00) and has stabilized back above its MA trend-line, confirming a bullish reversal. In addition, the 1W MACD just formed a Bullish Cross, with the previous 2 such formations since January 2023 aligning with the Wedge's Bullish Legs.
The previous Lower Lows bottom reached marginally above the 0.786 Fibonacci retracement level. As a result we remain committed to our long-term Target of 2.600 (below also the Lower Highs trend-line), which we expect to get hit within the next 4 months.
-------------------------------------------------------------------------------
** Please LIKE 👍, FOLLOW ✅, SHARE 🙌 and COMMENT ✍ if you enjoy this idea! Also share your ideas and charts in the comments section below! This is best way to keep it relevant, support us, keep the content here free and allow the idea to reach as many people as possible. **
-------------------------------------------------------------------------------
💸💸💸💸💸💸
👇 👇 👇 👇 👇 👇

RBOB Gasoline Broke The Weekly Base SupportFrom Sep. 2022, we see the bounces at the white Centerline. This created great support, until recently Sep. 03/24.
The Base support is broken, and price failed to move up from the white Centerline.
Well, if price is not going up, it probably goes down. Potential targets are indicated by the arrows.

GASOLINE: Turned bullish on 4H as the MA50 held.Gasoline turned bullish on its 4H technical outlook (RSI = 56.424, MACD = 0.010, ADX = 32.938) as it rebounded strongly on the 4H MA50. The overall pattern looks very much like the October 2nd 4H MA50 rebound, which rose to almost the 2.0 Fibonacci extension. That is our Target (TP = 2.1650), just under the R1 level.
## If you like our free content follow our profile to get more daily ideas. ##
## Comments and likes are greatly appreciated. ##

GASOLINE Bottom confirmed. 3-month rally ahead.Gasoline (RB1!) formed a confirmed technical bottom on the 3.5-year Support Zone and the Lower Lows of the Falling Wedge. At the same time, the 1W RSI bounced from oversold territory (below 30.00) back above its MA trend-line, confirming a bullish reversal.
The previous Lower Lows bottom reached marginally above the 0.786 Fibonacci retracement level. As a result we remain committed to our long-term Target of 2.600 (below also the Lower Highs trend-line), which we expect to get hit within the next 3 months.
-------------------------------------------------------------------------------
** Please LIKE 👍, FOLLOW ✅, SHARE 🙌 and COMMENT ✍ if you enjoy this idea! Also share your ideas and charts in the comments section below! This is best way to keep it relevant, support us, keep the content here free and allow the idea to reach as many people as possible. **
-------------------------------------------------------------------------------
💸💸💸💸💸💸
👇 👇 👇 👇 👇 👇

COT Analysis Summary - Energy SectorA few weeks ago, I was calling for longs in CL, HO & RB based on the COT strategy. The move is underway, but based on new analysis this week, I would look to take further long entries in these energy markets. There are currently no COT strategy setups for NG.

Smart Money Positioned to LONG RBOB - COT StrategyDISCLAIMER: This is not trade advice. This is for educational purposes only to demonstrate how I am looking to participate in this market. There is significant risk involved in trading, do your own homework and due diligence.
COT Strategy
Long
(RBOB)
My COT strategy has me on alert for long trades in RBif we get a confirmed bullish change of trend on the Daily timeframe.
COT Commercial Index: Buy Signal
Extreme Positioning: Commercials max long of last 3 years - bullish. Small specs max short of last 3 years - bullish.
OI Analysis: Multi week down move has seen OI increase. When OI increases, we need to ask "who is causing the OI increase?". In this case, OI is increasing as Commercials add to long positioning, which is bullish.
ADX: Paunch forming (but not confirmed until ADX rollover). This is a significant "end of trend" indication.
Front Month Premium - bullish.
COT Small Spec Index: Buy Signal
Supplementary Indicators: %R & Stochastic
Remember, this is not a "Long Now" idea. These indicators are not timing tools. They simply tell us that this market could have a move of some significance to the upside, which we will participate in with a confirmed Daily trend change to the upside.
Good luck & good trading.

GASOLINE Do-or-die moment before total collapse.Gasoline (RB1!) is approaching not only the Lower Lows trend-line from the December 12 2022 Low but also the Support Zone that has been in effect in the past 3.5 years. Naturally, this is the most critical Support Cluster of all, if the market is avoid a brutal sell-off in the coming months. That will be if Gasoline closes a month below the Support Zone.
Until then, this is its last chance to stage another multi-month Bullish Leg similar to those of early 2023 and early 2024. As long as the Support Zone holds then, we will target 2.6000, which is below the 0.786 Fibonacci retracement level as well as the Lower Highs trend-line.
-------------------------------------------------------------------------------
** Please LIKE 👍, FOLLOW ✅, SHARE 🙌 and COMMENT ✍ if you enjoy this idea! Also share your ideas and charts in the comments section below! This is best way to keep it relevant, support us, keep the content here free and allow the idea to reach as many people as possible. **
-------------------------------------------------------------------------------
💸💸💸💸💸💸
👇 👇 👇 👇 👇 👇

RBOB Gasoline - COT & Fundamental Backed Long Trade SetupDISCLAIMER: This is not trade advice. This is not a recommendation to take a trade. This is for purely educational purposes only.
RBOB (Gasoline) is "Set Up" for Longs.
This does not mean I am longing this blindly right now.
The tools that I am using to formulate this trade idea are not timing tools. We use technical entry techniques to time our entry.
Lets get to it.
Commercials are extremely long this market. The last time they were this long was in 2010, which just so happened to preclude a massive bull move in RBOB. When Commercials are at a significant extreme, we want to pay attention.
Small speculators are very short. In fact, they are more short than they have been in the last 3 years. The public is generally wrong, and we want to fade whatever they are doing.
Advisor sentiment is very bearish, which is actually bullish. If the advisors are telling all their clients to Sell gasoline, who is left to sell?
For weeks, OI has been decreasing while Commercials have added to their long positioning. If the public and large speculators are not interested in this market, while the commercials are getting heavily long, this is bullish and indicates this market is ready for a bullish move.
Cyclically, we get a bit of a mixed bag. The decennial pattern is supportive of some upside soon, and the annual cycle is supportive of a major low in September.

GASOLINE Strong buy opportunity.Last time we looked into Gasoline (RB1!) was exactly 2 months ago (June 06, see chart below) and the price action gave us the most optimal buy opportunity on the 0.618 Fibonacci level and hit straight on our 2.6000 Target:
Since then, Gasoline declined aggressive along with most of the energy sector and even broke below the 0.618 Fib on Monday. This however is technically the ideal long-term buy entry as not only the dominant pattern remains a 2-year Channel Down but also in symmetrical terms, it appears that the price action may be on similar levels as the June 23 2023 Low.
As a result, we turn bullish on Gasoline again, targeting the Internal Lower Highs trend-line at 2.7500.
-------------------------------------------------------------------------------
** Please LIKE 👍, FOLLOW ✅, SHARE 🙌 and COMMENT ✍ if you enjoy this idea! Also share your ideas and charts in the comments section below! This is best way to keep it relevant, support us, keep the content here free and allow the idea to reach as many people as possible. **
-------------------------------------------------------------------------------
💸💸💸💸💸💸
👇 👇 👇 👇 👇 👇

GASOLINE Medium-term buy opportunityGasoline (RB1!) has been on a strong Bearish Leg ever since the April 12 High, which is a Lower High for the 2-year Channel Down, and even broke below the 1D MA200 (orange trend-line). Having already touched the 0.618 Fibonacci retracement level, we expect a medium-term rebound, similar to the one on May 04 2023.
The rally not only hit and broke above the 1D MA50 (blue trend-line) but also extended as high as the 0.236 Fib. As a result, we consider the current level to have a solid R/R behind it and buy, targeting 2.600 (just below the 0.236 Fib).
-------------------------------------------------------------------------------
** Please LIKE 👍, FOLLOW ✅, SHARE 🙌 and COMMENT ✍ if you enjoy this idea! Also share your ideas and charts in the comments section below! This is best way to keep it relevant, support us, keep the content here free and allow the idea to reach as many people as possible. **
-------------------------------------------------------------------------------
💸💸💸💸💸💸
👇 👇 👇 👇 👇 👇

RB - Potential for scalping a squeezePotential to catch a scalp with possible squeeze momentum after BO of sustained bear trend,
Would need significantly more bars with good bulllish momentum to consider long.

GASOLINE Short-term buy. Sell at the right time.Gasoline (RB1!) is on a 3-day bullish 1D candle run after testing and holding the 1D MA50 (blue trend-line) this week for the first time since February 05. On the wider scale, this is the Bullish Leg of the 18-month Channel Down and it is approaching its top (Lower Highs trend-line).
As you can see, the Bullish Legs of this pattern share a certain degree of symmetry, so as it happened on April 12 2023, we expect the new Lower High to be priced near the 1.236 Fibonacci extension. That will also touch the internal Higher Highs trend-line. The symmetrical 1D MACD Bullish Cross of March 27 2023, was a signal that the Bullish Leg will soon come to an end.
As a result, on the 1.236 Fib we will turn bearish and target the bottom of the (dotted) Channel Up at 2.6000.
-------------------------------------------------------------------------------
** Please LIKE 👍, FOLLOW ✅, SHARE 🙌 and COMMENT ✍ if you enjoy this idea! Also share your ideas and charts in the comments section below! This is best way to keep it relevant, support us, keep the content here free and allow the idea to reach as many people as possible. **
-------------------------------------------------------------------------------
💸💸💸💸💸💸
👇 👇 👇 👇 👇 👇

Cup and Handle Pattern in Gasoline!Next to Cocoa, Gasoline comes in 2nd place for the best total return performance in Q1 2024 amongst commodity markets. The infamous cup and handle pattern has emerged, adding a level of upside conviction in this trade.
Fundamentals:
Severe weather developments here in the USA and geopolitical supply chain disruption have caused refiner input costs to tick up slightly faster than normal. According to FactSet, the cost of gasoline shipments into New York Harbor next month has jumped 28% since the beginning of the year. This increase surpasses the average of 20% seen during the same period over the past quarter-century.
According to Bloomberg, "In Russia, an expanded Ukrainian drone campaign has hammered key refineries. The damage has required months-long repairs and pushed the Kremlin to conserve domestic supplies by curbing fuel exports."
Despite record U.S. production, these supply chain shocks have helped boost gasoline prices, thereby increasing refinery profits and margins for those companies that can remain operational. The next OPEC meeting is due on April 3rd, where further production cuts will act as another tailwind for higher crude and gasoline prices.
Technicals:
From a technical perspective, we can see a clear cup and handle pattern forming, which is typically a bullish chart pattern. We would need to see a break and close above $2.85 (the top of the August 15th gap lower) before testing the next major level of $2.95-$2.985. A break and close above this level is likely to lead to an upside breakout.
Check out CME Group real-time data plans available on TradingView here: www.tradingview.com
Disclaimers:
CME Real-time Market Data help identify trading set-ups and express my market views. If you have futures in your trading portfolio, you can check out on CME Group data plans available that suit your trading needs www.tradingview.com
*Trade ideas cited above are for illustration only, as an integral part of a case study to demonstrate the fundamental concepts in risk management under the market scenarios being discussed. They shall not be construed as investment recommendations or advice. Nor are they used to promote any specific products, or services.
Futures trading involves substantial risk of loss and may not be suitable for all investors. Trading advice is based on information taken from trade and statistical services and other sources Blue Line Futures, LLC believes are reliable. We do not guarantee that such information is accurate or complete and it should not be relied upon as such. Trading advice reflects our good faith judgment at a specific time and is subject to change without notice. There is no guarantee that the advice we give will result in profitable trades. All trading decisions will be made by the account holder. Past performance is not necessarily indicative of future results.

Market maturity in wave 1 and 2! or sideways corrective patternDear analysts and traders,
I hope you are doing well and are motivated for the week ahead. I wish you all the success in your business endeavors. Remember that success in trading lies in consistently defining and sticking to your rules.
As someone interested in the Elliott Wave Principle, I find it to be an invaluable tool for market analysis. I have developed my approach by combining this principle with my personal experience and by considering different scenarios that are likely to occur in the market. It should be noted that I do not like to be surprised in the market, and that's why I have different market prospects. I follow them to be sure and recognize the structure that is forming so that I can 100% recognize it.
I will share my analysis with you, but please note that I am not providing any buy or sell signals. My perspective on idea analysis is completely unbiased, so if the idea analysis meets your standards, you can use it as a guide to make an informed decision.
I have attached my previous analysis of the same market so that you can compare and see the differences. All the details of my analysis are clearly labeled, making it easy for you to understand. However, having a basic familiarity with the Elliott Wave Principle theory will help you understand the analytical idea more easily.
I have been studying the Elliott Wave Principle for almost three years now, and over time, my understanding of this knowledge and experience has grown. What I have achieved so far is the legacy of a genius called Ralph Nelson Eliot, and I am really happy with my progress. May peace be upon him.
Thank you for your support so far. I will always remember your kindness. Please share your comments and criticisms with me.
I hope my analysis will be useful to you in your business journey, and I wish you all the best.
Sincerely,
Mr. Nobody
