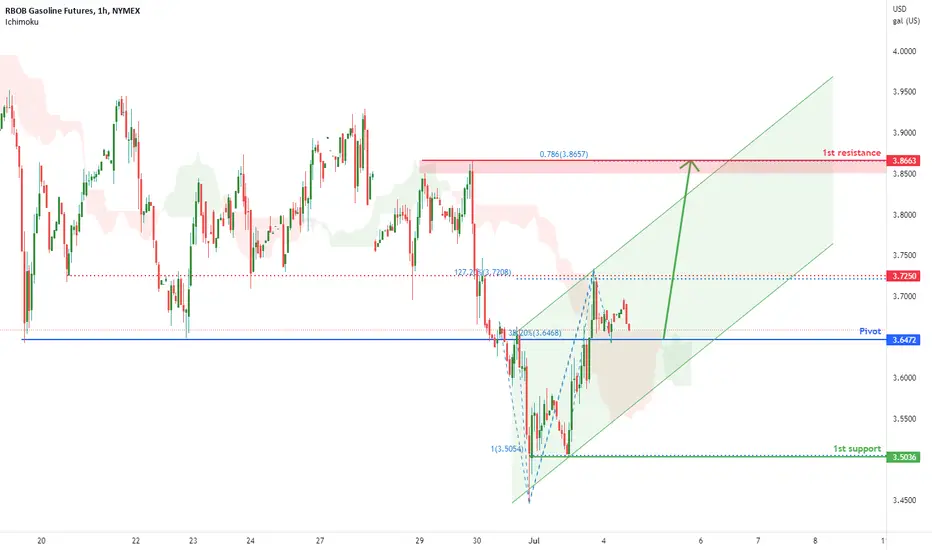
RBOB GASOLINE FUTURES (RB1!), H1 Potential for Bullish RiseType : Bullish Rise
Resistance : 3.8663
Pivot: 3.6472
Support : 3.5036
Preferred Case: On the H4, with price moving above the ichimoku cloud and within the ascending channel , we have a bullish bias that price will drop and rise from the pivot at 3.6472 in line with the overlap support and 38.2% fibonacci retracement to the intermediate resistance at 3.7250 where the 127.2% fibonacci extension and overlap resistance are. Once there is upside confirmation of price breakthough of intermediate resistance, we would expect bullish momentum to carry price to the 1st resistance at 3.8663 where the swing high resistance and 78.6% fibonacci projection are.
Alternative scenario: Alternatively, price may break pivot structure and drop to the 1st support level at 3.5036 in line with the swing low support and 100% fibonacci projection .
Fundamentals: Due to global supply demand issues of gasoline originating from the sanctions in place against Russia, we have a bullish view on gasoline.
THU1! trade ideas

RBOB GASOLINE FUTURES (RB1!), H1 Potential for Bullish RiseType : Bullish Rise
Resistance : 3.8663
Pivot: 3.6472
Support : 3.5036
Preferred Case: On the H4, with price moving above the ichimoku cloud and within the ascending channel , we have a bullish bias that price will drop and rise from the pivot at 3.6472 in line with the overlap support and 38.2% fibonacci retracement to the intermediate resistance at 3.7250 where the 127.2% fibonacci extension and overlap resistance are. Once there is upside confirmation of price breakthough of intermediate resistance, we would expect bullish momentum to carry price to the 1st resistance at 3.8663 where the swing high resistance and 78.6% fibonacci projection are.
Alternative scenario: Alternatively, price may break pivot structure and drop to the 1st support level at 3.5036 in line with the swing low support and 100% fibonacci projection .
Fundamentals: Due to global supply demand issues of gasoline originating from the sanctions in place against Russia, we have a bullish view on gasoline.
Has Gasoline Price Already Peaked?NYMEX:RB1!
While the U.S. stock market performed miserably lately, energy commodities have a banner year. According to the American Automobile Association (AAA), the national average gasoline price reached an all-time high of $5.016 a gallon on June 14th. Diesel logged its own record on June 19th, at $5.816 a gallon.
Crude oil price hike is certainly a major contributing factor. However, refined products have been rising a lot faster. AAA gasoline was at record high $4.114 in July 2008 when WTI crude oil made history at $147 a barrel. Last month, WTI peaked at $123, at 16% below the 2008 high. However, gasoline broke $5, a whopping 22% above its 2008 record.
Since mid-June, WTI lost steam and entered a downturn. It trades below $110 today. Meanwhile, gasoline price barely moved and still stands above $4.80 per AAA data.
In my view, the gasoline market has already peaked, and a downtrend would follow. RBOB gasoline wholesale price, currently at $3.68 a gallon, could fall 30% or more in the next year. I came to this assessment based on two key factors:
Firstly, refining margins could decrease significantly due to mean reversion.
Refinery is the process to turn crude oil into gasoline, diesel, heavy fuel oil and other petrochemical byproducts. Refining margin measures the revenue from selling refined products, subtracting the cost of crude oil and natural gas going into the process. Below is a simple formula:
Refining margin = revenue (94% of crude processed) - costs (crude oil + natural gas used)
Whereas refining revenue = 23% gasoline + 63% diesel oil + 8% heavy fuel oil
A barrel of 42-gallon crude oil is processed into 40 gallons of refined. For each barrel, you would get approximately 25 gallons of gasoline, 9 gallons of diesel, and 3 gallons of heavy fuel oil.
According to Polish oil refiner LOTOS Group, the latest daily model refining margin is $59.06 per barrel of crude oil. Before the Russia-Ukraine conflict, refining margin was below $10 in February. Margins were in single digits throughout 2021 and sometimes even turned negative.
Crack Spread is a “quick and dirty” way to measure profit margin of a U.S. refinery. To calculate the 3:2:1 crack spread for a Gulf Coast refinery that processes Louisiana Light Sweet (LLS) crude oil, add the spot price for two barrels of Gulf Coast conventional gasoline to the spot price for one barrel of Gulf Coast ultra-low sulfur diesel. Then subtract the spot price for three barrels of LLS crude oil. Finally, divide the result by 3 to produce a crack spread in dollars per barrel.
Once the summer driving season is over, I expect crack spread to go down due to a combination of market force (reduced demand) and political pressure.
Secondly, gasoline demand could decline significantly in a U.S. economic recession.
In the past 15 years, gasoline market has crashed three times. The first was in 2008, following the subprime crisis. The second time in 2014, driven by a 60% crude oil price fall. The latest was in March 2020 when COVID-19 broke out in the U.S., leading most states to travel restrictions, lock-down or social distancing.
Today, a Federal Reserve tracker suggests that the U.S. has already entered a recession. The Atlanta Fed’s GDPNow, which tracks economic data in real time, sees second-quarter GDP contracting by 1%. Coupled with the first-quarter’s 1.6% decline, two consecutive quarters of negative GDP fits the technical definition of a recession.
Gasoline market is very sensitive to changes in consumer spending. Automobile driving, which shows clear “seasonal patterns”, is the dominant demand factor. In my view, this is the defining price driver in RBOB. For viewers who read my previous writings, you would understand why I prefer RBOB over WTI in forming a trading strategy – it’s more straight-forward with fewer moving parts.
A short position in NYMEX RBOB Gasoline Futures (RB) is a way to express this bearish view. The January (RBF3) contract is quoted at $2.779 on July 1st. RBOB futures is based on wholesale gasoline price. We could add $1 to RBF3 to get to a ballpark estimate of retail price in January. For the month after the Christmas holiday seasons, $3.80 a gallon seems to be overpriced.
RBOB futures is quoted at USD per gallon. Each contract has a notional value of 42,000 gallons (1,000 barrels), equivalent to $116,760 in current market value. To place an order, $8,500 margin is required per contract. A move of 1 cent in gas price will result in $420 gain or loss to your account.
Alternatively, if you are uncertain of which direction gasoline price would go, but agree that refining margin could revert to mean, we could Short the Crack Spread . A 3-2-1 short crack spread can be constructed by placing 3 Short WTI, 2 Long RB and 1 Long HO contracts.
We can also monitor the following data points to be released to test the validity of these two trade set-ups:
• Holiday driving data (July 4th, Labor Day, Thanksgiving and Christmas)
• Q2 and Q3 earnings releases from the retail sector (Walmart, Target, Dollar General, etc.)
• Q2 and Q3 GDP data
• Monthly CPI data
• Fed rate decisions (JUL 26-27, SEP 20-21, NOV 1-2, and DEC 13-14)
Russia-Ukraine conflict poses the biggest risk to our trade. If the contagion risk intensifies and ripples through Europe, energy prices could hike sharply again.
Happy Trading.
Disclaimers
*Trade ideas cited above are for illustration only, as an integral part of a case study to demonstrate the fundamental concepts in risk management under the market scenarios being discussed. They shall not be construed as investment recommendations or advice. Nor are they used to promote any specific products, or services.

Gasoline futures - what's brewing?The recent plunge in commodities has seen Gasoline futures tumble --- price is down 20% from its recent highs -- and evidence is mounting there could be more. Here is what we are seeing under the surface:
1. Head and shoulders activated:
The market has broken the neckline of a head and shoulders pattern, which is a pattern with 3 peaks, where the central peak is the highest --- the head. The two lower peaks on either side of this head are the left and right shoulder; now the sizes of these shoulders can vary and in this case, the right shoulder is "shallower" which represents weakness. Also notice that the neckline is upward sloping and as we speak, is broken, thereby activating additional downside. The target is the vertical distance from the head to the neckline, reduced from the point of breakdown --- making $2.93 a possibility based on this pattern alone. This is a "typical" target, it may be met or it may not be. In case of the latter, the failure to meet the downside target will be an indication of "strength" and the resulting rally can be furious.
2. Moving Average support broken:
The 55-day SMA has been a key marker which has led to reactions in the past, particularly during corrections within the prior uptrend. Although the DMA is still rising, any further sideways/downward movement in price will flatten the average out, emboldening the bear.
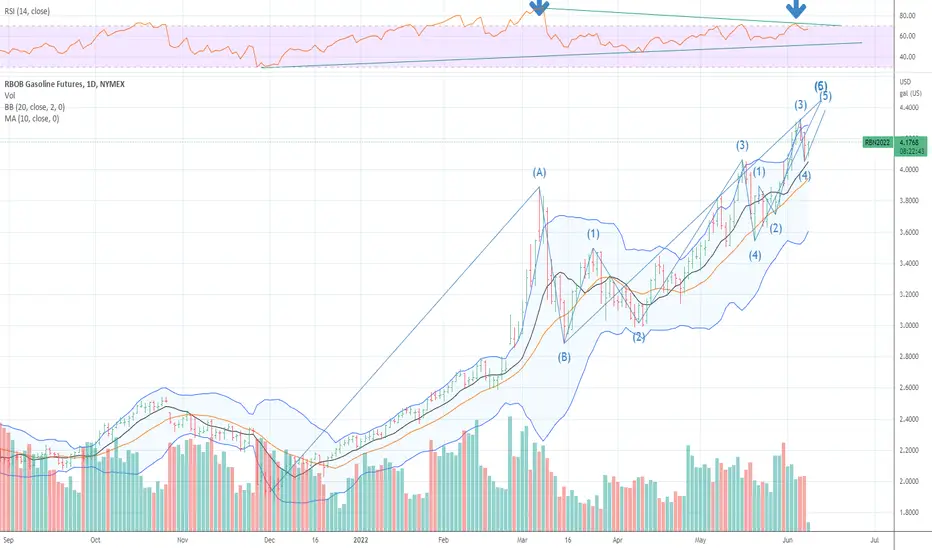
3. Elliott wave count:
There will be, as there always is, a couple of alternate counts to the preferred EW labelling used here. I believe some sort of a 3rd wave peak occurred at the $3.89 high. From here, a sharp decline ensued which was retraced in its entirety by the subsequent recovery to the $4.32 high. However, this looks more like a B wave. Therefore, we believe the sharp decline from $3.89 to $2.88 was an A.
Now this means we are either doing a Flat (3-3-5) or a Running triangle (3-3-3-3-3) where wave (b) of the triangle exceeds the length of wave (a) of the pattern. The flat could either be an expanded flat or a running flat (rare). If its a running triangle, then more churn is expected between $2.88 and $4.32 --- yes its a large range, but the expanded volatility of the market means this range will continue to hold till the pattern completes itself and leads to a truly trending move.
Regardless of the internals of the count, if the $3.89 high was only a wave 3 high (of some degree), then this correction is a wave 4 and therefore, the door is still open for Gasoline to travel higher in a 5th wave --- once the current bearish trend exhausts itself. We will wait for the market to move and eliminate some viable possibilities and truly zero down on what is really the preferred path. Right now, both the flat and the triangle pattern are valid, so we take it one day at a time.
4. Supports
Some possible areas of support from my several years of experience with the wave theory lie at $3.35 - $3.13 - $2.98
Good luck trading and happy weekend to all. Stay safe.
- Guest Author on behalf of the CMT Association

Elevated Refinery Margin Suggests Additional Oil UpsideRefinery margin explained:
The refinery margin is the percentage of profit generated from the sale of refined crude products. A 3:2:1 refinery spread margin percentage is charted here. A 3:2:1 refinery spread approximates the profit generated from a barrel of oil by subtracting the cost of 3 barrels of crude oil from the revenue generated via the sale of 2 barrels of gasoline and 1 barrel of heating oil.
When the profit is divided by the total revenue, as this chart does via the formula below, then a percentage of profit is calculated, ie. a refinery margin.
Side notes: Heating oil contracts are traded as diesel fuel hedges because heating oil and diesel are distilled from similar temperature ranges, with heating oil being slightly heavier. The abbreviation for barrel = bbl
Refinery margin = profit/revenue = (2bbl gasoline + 1bbl diesel - 3bbl crude)/(2bbl gasoline + 1bbl diesel) = (84*RB1! + 42*HO1! - 3CL1!)/((84*RB1! + 42*HO1!)
There are 42 gallons in a barrel so RB and HO which are priced in gallons need to be multiplied by 42 to convert to barrels so as to have the same units as CL which is priced in barrels. The formula as entered into tradingview is divided by 3 to factor out the unnecessary 3. This step isn’t necessary and leaving it as written above will yield the same result, it’s just cleaner without the 3.
Chart explained:
The refinery margin going back to 1985 is plotted as a blue line for the purpose of identifying trends which tend to occur when it reaches the level of .328 i.e. 32.8% profit margin. The occurrences of that margin level are indicated with red vertical lines and there are arrows on the CL chart plotted below showing if the crude oil price reacted by going up using green arrows or if it reacted by going down using red arrows. There is a yellow arrow at the end because the future reaction to the currently-elevated margin is yet to be determined. RB1! and HO1! are shown below CL for reference. At this level of profit margin, crude tends to outperform gasoline and heating oil which causes the refinery margin to go down. This outperformance tends to come in the form of crude oil going up quicker than its products. Outperformance can also come in the form of oil not dropping as quickly as products or staying flat while products drop. Historically, oil has risen to bring the margin down, but also historically, RB and HO have not reached these levels and CL has not gone much higher than this, so this analysis is applying historical norms to historical aberrations. It suggests going long crude oil but that’s just my take on it.

Gasiline RBOB Commodity USA Sun Storm Investment Trading Desk & NexGen Wealth Management Service Present's: SSITD & NexGen Portfolio of the Week Series
Focus: Worldwide
By Sun Storm Investment Research & NexGen Wealth Management Service
A Profit & Solutions Strategy & Research
Trading | Investment | Stocks | ETF | Mutual Funds | Crypto | Bonds | Options | Dividend | Futures |
USA | Canada | UK | Germany | France | Italy | Rest of Europe | Mexico | India
Disclaimer: Sun Storm Investment and NexGen are not registered financial advisors, so please do your own research before trading & investing anything. This is information is for only research purposes not for actual trading & investing decision.
#debadipb #profitsolutions
Premium unleaded Rotterdam vs. BrentPremium unleaded went into heavy premium over Brent ahead of German tax changes 1.6.. Will probably reverse fast.

GASOLINE THE LAST GASP UP SPOT 4.38/4.54 Gas on the spot looks to be setup to run at another new high as the pullback was a nice abc down into what should be a final push to test new highs in a 5th wave in what I see as wave C of a massive abc deflationary cycle is hitting ALL assets as the forecast in DEC 2021 calls for use this next move up to go long puts in the oil stock sector
Gasoil chartLong-term gasoline chart. I'm waiting for a return from here. If that doesn't happen, I'll have to sell my car.

Crackspread is about to roll overAs seen in the past, the crack spread is about to roll over for the summer months until the fall shutdowns start again. How this plays out in the equities like $HFC is yet to be seen.

Long RBOB at Market 1st TP 387.90 Stop 352.40 Long RBOB at Market 1st TP 387.90 Stop 352.40
**Trading commodity futures and options involves substantial risk of loss.
The recommendations contained in this letter is of opinion only and
does not guarantee any profits. These are risky markets and only
risk capital should be used. Past performance is not indicative of future results**
hypothetical performance results have many inherent limitations, some of which are described below. no representation is being made that any account will or is likely to achieve profits or losses similar to those shown. in fact, there are frequently sharp differences between hypothetical performance results and the actual results subsequently achieved by any particular trading program.
one of the limitations of hypothetical performance results is that they are generally prepared with the benefit of hindsight. in addition, hypothetical trading does no involve fina
ncial risk, and no hypothetical trading record can completely account for the impact of financial risk in actual trading. for example, the ability to withstand losses or to adhere to a particular trading program in spite of trading losses are material points which can also adversely affect actual trading results. there are numerous other factors related to the markets in general or to the implementation of any specific trading program which cannot be fully accounted for in the preparation of hypothetical performance results and all of which can adversely affect actual trading results.

Energy is Breaking OutCrude Oil, Gasoline, and energy stocks are breaking out. These are the charts and trends we are watching most closely to confirm this breakout.

Gasoline Commodity USA Sun Storm Investment Trading Desk & NexGen Wealth Management Service Present's: SSITD & NexGen Portfolio of the Week Series
Focus: Worldwide
By Sun Storm Investment Research & NexGen Wealth Management Service
A Profit & Solutions Strategy & Research
Trading | Investment | Stocks | ETF | Mutual Funds | Crypto | Bonds | Options | Dividend | Futures |
USA | Canada | UK | Germany | France | Italy | Rest of Europe | Mexico | India
Disclaimer: Sun Storm Investment and NexGen are not registered financial advisors, so please do your own research before trading & investing anything. This is information is for only research purposes not for actual trading & investing decision.
#debadipb #profitsolutions

GASOLINE Buy the dip for the next 2 monthsGasoline (RB1!) has been supported by the 1D MA50 (blue trend-line) since January 2022 and after the most recent contact with the trend-line (April 07 2022), it has been on a strong rise.
This shouldn't surprise us as the 1D RSI has been printing the same pattern as the March - June 2021 period, when Gasoline formed a Channel Up supported by the 1D MA50. This suggests that every dip towards the Support should be bought until at least the end of July.
--------------------------------------------------------------------------------------------------------
** Please support this idea with your likes and comments, it is the best way to keep it relevant and support me. **
--------------------------------------------------------------------------------------------------------

Gasoline Commodity USA Sun Storm Investment Trading Desk & NexGen Wealth Management Service Present's: SSITD & NexGen Portfolio of the Week Series
Focus: Worldwide
By Sun Storm Investment Research & NexGen Wealth Management Service
A Profit & Solutions Strategy & Research
Trading | Investment | Stocks | ETF | Mutual Funds | Crypto | Bonds | Options | Dividend | Futures |
USA | Canada | UK | Germany | France | Italy | Rest of Europe | Mexico | India
Disclaimer: Sun Storm Investment and NexGen are not registered financial advisors, so please do your own research before trading & investing anything. This is information is for only research purposes not for actual trading & investing decision.
#debadipb #profitsolutions

GASOLINE ATH GASOLINE registered all time high passing above resistance of historic prices following by a local correction.
Fibonacci channel tilt is adjusted to the general direction of 2 year relevance projecting dynamic support levels in case of further correction.
It might touch red fib area couple of times before market reversal.
Previous ATH:

Be ready for much higher prices in 2022..!Gasoline has just crossed above its all time high and entered a No resistance zone..!
In 2008, gasoline rose to a record $4.11 a gallon, which equates to $5.20 a gallon today adjusted for inflation.(The Wall Street Journal)
Increases in Gas price in the inflation era + geopolitical tensions will last longer than your expectations..!
I think in 2022, all US refineries will beat their earning expectations by far..!
Best,
Dr. Moshkelgosha M.D.

Gas just got expensiveIn the chart is the M2 adjusted price of gasoline matched to the current price. It measures the portion of total dollars it would take to purchase a gallon of gasoline. Essentially it's a chart of dollar strength in gasoline terms.
Chart up = strong gas, weak dollar.
Chart down = weak gas, strong dollar.
The white trendline in the center is the longterm linear regression, the center of the logarithmic price distribution (but only back to 1986).
To calculate this symbol yourself:
RB1! price = 3.798
RB1! / WM2NS price = 0.0001758
3.798 / 0.0001758 = 21604
Now we simply enter RB1! /WM2NS*21604 to get our current price.
What the chart does not show is that over the years, public ownership of the dollar supply has gone down. As you pump unwarranted dollars into the economy, you get diminishing returns on real gdp growth and thus a reduction in productivity. No measurements are being made, dollars are only being thrown into the system. More doing, less thinking and measuring. Therefore, people have less overall dollars, relative to the total supply of dollars, to spend on gasoline as they did in previous decades. For example, around the 1970s, the FED could squeeze out about 70 cents in GDP per 1 dollar printed. (Actually they didn't squeeze anything, they just sat on their ass) Fast forward to 2022, these reckless and dogmatic pseudo-scientists are getting around 30 cents per dollar printed. If people are economically half as productive overall, PERHAPS everyday people will only be able to afford about HALF as much stuff and therefore half as much gasoline as when it was just as expensive in the past. Just something to think about, seeing as how regular citizens didn't get much of that money. Those who work the hardest are not worthy of the easy money printed by our glorious church of the FED.
Consider how gasoline peaked around 7$ multiple times, in '85, '90, '05, '06. Now imagine if society was half as productive back then, that's basically saying it's 14$ in today's terms if you account for money productivity AND money supply expansion.
Probably not the most settling idea.
Good luck and hedge your bets.

Interesting ChartThe breaking of the upward or downward channel could determine the confirmation of the Broadening or the return towards the lows of the main pattern

Gasoline Long in the short term, Short in the Long term.
I think we are reaching the end of the Covid bull run for this commodity.


RBOB - (RB) Gasoline The SPR release was a non-event, why would it be.
Less asphalt is preferable.
Heavy Sours are not ever going to relieve Price.
The exception is DOT projects.
_____________________________________________
April to June as the Flip for unleaded fuel production.
Refineries lead this transition and switch over to summer-
blend production in March and April.
In the warmer months, gasoline has a greater chance of evaporating.
Refiners reduce the chance of gas evaporation in your car during the s
summer by producing gasoline blends that have lower Reid vapor pressure,
or lower volatility.
This isn't going to affect price this year.
______________________________________________
The Variant will, demand for Gasoline
Liquid fuels will increase by 3.5 million b/d in 2022 to average 100.5 million.
Given demand is well below 100 Million, we doubt this.
War Drum will likely have the desired effect and those are rapidly building
Globally as China has become an Isolationist.
Russia is keen on pushing back against an attempt to regain the upper hand in
NATO for the purposes of putting Putin in a corner.
2022 has the potential to be a very challenging year on many fronts.
Price volatility will increase dramatically as Energy moves in far greater swings.
________________________________________________
There is a rather Large Daily GAp Above.
