SOMETHING VERY BAD MAYBE ABOUT TO HAPPEN I HOPE I AM WRONG HIGHER GAS PRICES WOULD CHOKE THE POCKETS OF ALL IF THIS TURNS OUT THIS IS THE ONLY POST I HOPE FOR US ALL IS WRONG
THU1! trade ideas


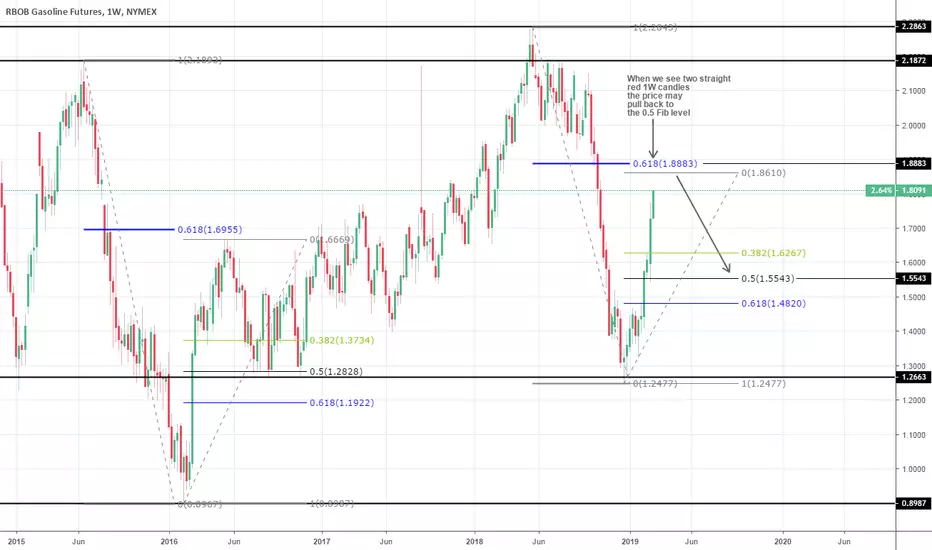
Gasoline: How high can it get?This is a long term analysis on Gasoline on the 1W chart. We are trying to determine where this aggressive buying sequence that started at the end of December will stop.
The previous similar sequence stopped just below the 0.618 Fibonacci retracement level. Then it bottomed just under the 0.500 level and consolidated before it resumed the uptrend.
We expect a similar pattern this time as well. The current 0.618 Fibonacci level is at 1.8883, so expect a top around 1.8600. Similarly the 0.500 level is at 1.5543, so this is a projected pull back mark.
This analysis is best suited for long term traders and investors who are looking for a safe and high R/R position for the next bull run.
** If you like our free content follow our profile (www.tradingview.com) to get more daily ideas. **
Comments and likes are greatly appreciated.
GASSED up!We got a very pretty looking IHS breakout in gasoline futures this week. It's also a leading indicator for light sweet crude, brent crude, etc.. Sorry but gas prices are going up. Targeting $1.65.

What RBOB repeats 2016 cycle.We will see but looks similar What RBOB repeats 2016 cycle.We will see but looks similar so far.RBOB could 1.10 by the end of the month.


RBOB GASOLINE FUTURES (MAR 2019), 1D, NYMEXTrading Signal
Long Position (EP) : 1.4264
Stop Loss (SL) : 1.4061
Take Profit (TP) : 1.5075
Description
RBH2019 Roll over from RBG2019 Double Repo Failure Buy at 1d time frame. Trade setup with Buy Limit at 0.382 Level (1.4264) and place stop after 0.618 level (1.4061). Once the position was hit, place take profit before an agreement (1.5075)
Money Management
Money in portfolio : $280,000
Risk Management (1%) : $2,800
Position Sizing
$0.0001 = +-$4.2
Commission fee = -$2.37/std-contract
EP to SL = $0 = -$852.6
Contract size to open = 3 standard contracts
EP to TP = $0.1 = +$3,406.2
Expected Result
Commission Fee = -$14.22
Loss = -$2,557.8
Gain = +$10,218.6
Risk/Reward Ratio = 3.97

RBOB GASOLINE FUTURES (FEB 2019), 1D, NYMEXTrading Signal
Short Position (EP) : 1.4468
Stop Loss (SL) : 1.4677
Take Profit (TP) : 1.405
Description
RBG2019 formed Double Repo Failure Sell at 1d time frame. Trade setup with Sell Stop at 0.382 Level (1.4468) and place stop after 0.618 level (1.4677). Once the position was hit, place take profit before an agreement (1.405)
Money Management
Money in portfolio : $280,000
Risk Management (1%) : $2,800
Position Sizing
$0.0001 = +-$4.2
Commission fee = -$2.37/std-contract
EP to SL = $0 = -$877.8
Contract size to open = 3 standard contracts
EP to TP = $0 = +$1,755.6
Expected Result
Commission Fee = -$14.22
Loss = -$2,633.4
Gain = +$5,266.8
Risk/Reward Ratio = 1.98

RBOB GASOLINE FUTURES (FEB 2019), 1D, NYMEXTrading Signal
Long Position (EP) : 1.4138
Stop Loss (SL) : 1.3935
Take Profit (TP) : 1.4949
Description
RBG2019 formed Double Repo Failure Buy at 1d time frame. Trade setup with Buy Limit at 0.382 Level (1.4138) and place stop after 0.618 level (1.3935). Once the position was hit, place take profit before an agreement (1.4949)
Money Management
Money in portfolio : $280,000
Risk Management (1%) : $2,800
Position Sizing
$0.0001 = +-$4.2
Commission fee = -$2.37/std-contract
EP to SL = $0 = -$852.6
Contract size to open = 3 standard contracts
EP to TP = $0.1 = +$3,406.2
Expected Result
Commission Fee = -$14.22
Loss = -$2,557.8
Gain = +$10,218.6
Risk/Reward Ratio = 3.97

RISING CHANNEL IN GASOLINE (TRAILS CRUDE OIL)No long explanation here, a rising channel in gasoline which will break to the downside so we are not yet cleared for bull trend just yet, same goes for crude oil as gasoline market trails crude, though sometimes ahead of crude in movement.
HELPFUL VIDEOS TO TEACH YOU:
www.youtube.com
www.youtube.com
DISCLAIMER;
Do set stop losses when trading but be generous with how much room you allow for this due to candle wicks and there is also the possibility to hedge yourself, for more confident traders.
All comments and questions welcome, if curious about indicators I use then feel free to inquire. IF YOU SUPPORT MY IDEAS, LIKE, FOLLOW & SHARE. ~ THANKS! ~

GASOLINE Double bullish signalTwo bullish patterns: Rising Wedge on 1D, Potential Channel Up on 4H.
TP in both cases = 1.4690.

Buy GasolineThis is just a journal for me. I strongly warn you to not take this in your real account. Good luck!


LONG UGA @ $28.50 for Gasoline Futures bounce from $1.64Gasoline Futures (RBOB Gasoline Futures) likely counter trend bounce here off 200weekSMA support at $1.66 to reclaim long-term moving average support of 50monthSMA at $1.70, then rally to test 100weekSMA resistance at $1.80.
Technical Analysis:
- Gasoline Futures (RBOB Gasoline Futures) now testing long-term support of 200weekSMA at $1.66.
- $1.66 also strong price support from Feb 2018 for potential double bottom pattern
- Daily & Weekly RSI extremely oversold
- Daily MACD record lows
- 50monthSMA long-term support sitting at $1.70 to continue uptrend from 2016 lows
- Potential bottom hammer candle on hourly chart today at $1.66
Fundamental Analysis:
Over recent weeks, we have seen an almost perfect bearish storm in the Crude Oil market that sent the price of futures from a high of $76 to low of $61, a decline of about 19% in less than one month. Rising production, increasing inventories, a strong dollar, concerns over trade, and the realization that the sanctions on Iran include some exceptions, all led the price of the energy commodity lower in a dramatic corrective move. These factors have had a greater impact on its bi-product Gasoline, which is also undergoing a seasonal bearish period during the winter months. However, we feel this move has been overextended to the downside as there are still 3 fundamental reasons why oil is close to low and could spark a counter trend rally in Gasoline.
- Turmoil in the Middle East could result in a decrease in production and rapid price increase
- OPEC expected to cut production at their bi-annual meeting Dec. 6th
- Pullback of USD from highs due to US election results could relieve some of the bearish weight on commodity prices
- Demand for the energy commodity remains strong with increasing population and rising heating oil cracks


Crack Spread close to its extremeWe think it is worth to have an eye on this crack spread between gasoline and heating oil. The reason is simple: this spread is close to its lower end of the range and therefore close to its extreme. We will buy this spread when the spread reached -0.40. In this case, we buy RB and sell HO.

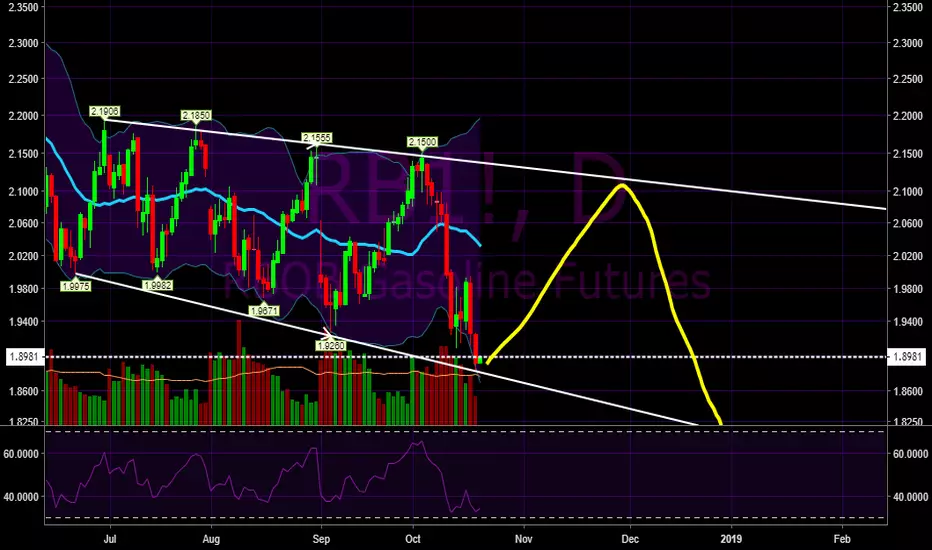
Gasoline forecast until end of year (RBOB)Looks like the price will remain in this channel until the end of the year, look out for confirmation of the long movement, then short when you get confirmation of the movement down from the top.
Hit like if you agree.
Follow for more forecasts like this.

Eroding Gulf Coast Crack Spreads--Bearish for refiners like VLOBrent vs. WTI spread continues to remain strong and pulling up the value of Gulf Coast crude, which in turn is driving erosion in Gulf Coast crack margins (represent by blue line on the chart). Valero stock price (candlesticks on the chart) is reacting to deteriorating refined products margins. Bearish until crack spreads reverse course.
