PLATINUM FUTURES (APR 2019), 1D, NYMEXTrading Signal
Short Position (EP) : 814.5
Stop Loss (SL) : 828.5
Take Profit (TP) : 786.5
Description
PLJ2019 formed Double Repo Failure Sell at 1d time frame. Trade setup with Sell Stop at 0.382 Level (814.5) and place stop after 0.618 level (828.5). Once the position was hit, place take profit before an agreement (786.5)
Money Management
Money in portfolio : $280,000
Risk Management (1%) : $2,800
Position Sizing
$0.1 = +-$5/std-contract
Commission fee = -$2.37/std-contract
EP to SL = $14 = -$700
Contract size to open = 4 standard contracts
EP to TP = $28 = +$1,400
Expected Result
Commission Fee = -$18.96
Loss = -$2,800
Gain = +$5,600
Risk/Reward Ratio = 1.99
TPLM1! trade ideas


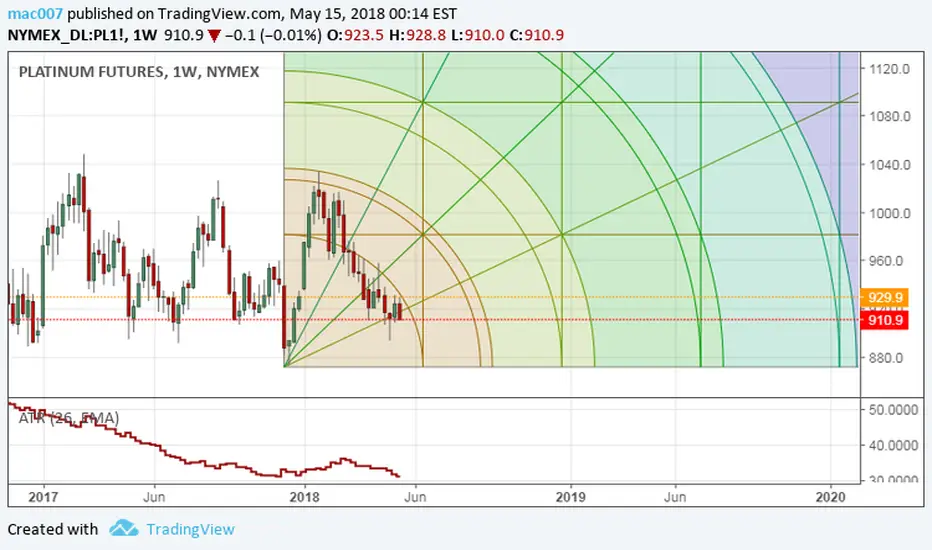
Time GuesstimateWe are watching a bearish movement based on the drive of the time target. Next could be probable up/down/up trend respectively.
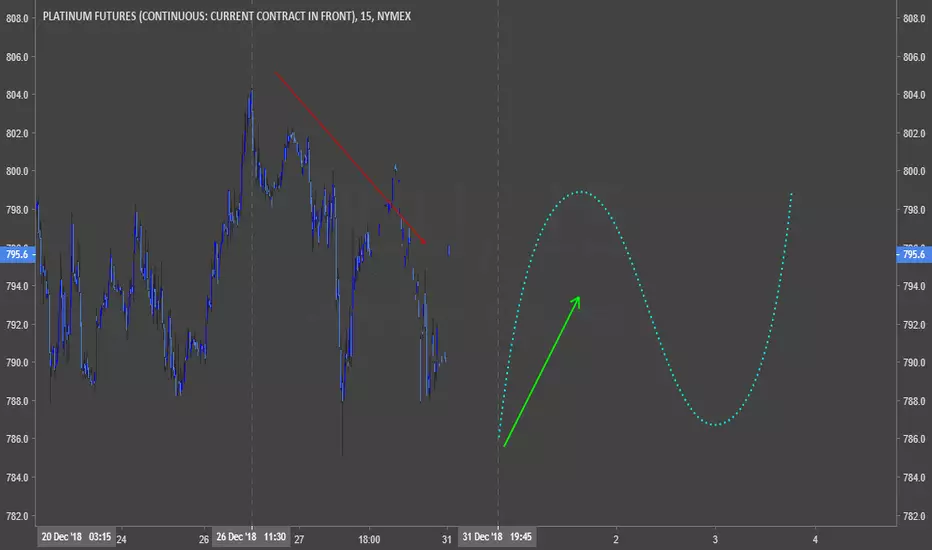
PLATINUM FUTURES JANUARY 2019 (PLF2019) (PL)Platinum futures are moving in a clear downtrend as suggested by the weekly chart. On the 4-hour chart, prices seem to be moving in a downtrend and forming a falling wedge pattern. We can speculate a brief break to the upside, followed by a continued downward movement. However, my bias is short as most markets are hit hard by the power of the bear.

Platinum - Hit Demand Zone & IHS FormationPlatinum, also known by the nickname "Rich's Man Gold" hit strong support level that caused major trend reversal in 2008 (demand zone) as well as 1.618 Fibonacci extension based on prior wave down below the crucial support. On the daily TF it can be seen that potential inverted head and shoulders pattern has formed or is in the process of forming - aka bullish set up / trend reversal. The way I see it - price has just completed a 5th sub wave of major wave 1 so will likely retrace a bit / form right shoulder (where one could consider opening a long position) then continue higher. ATM I am targeting the top of the channel but break above it will result in trend becoming even more bullish. Currently bear div can be observed on RSI 1D TF and the MACD has crossed bearish. I have placed my buy limit orders in 795 - 814 range - marked green. Expectations for metals are bullish. But can metals and dollar move together? You bet your bottom dollar they can. :)


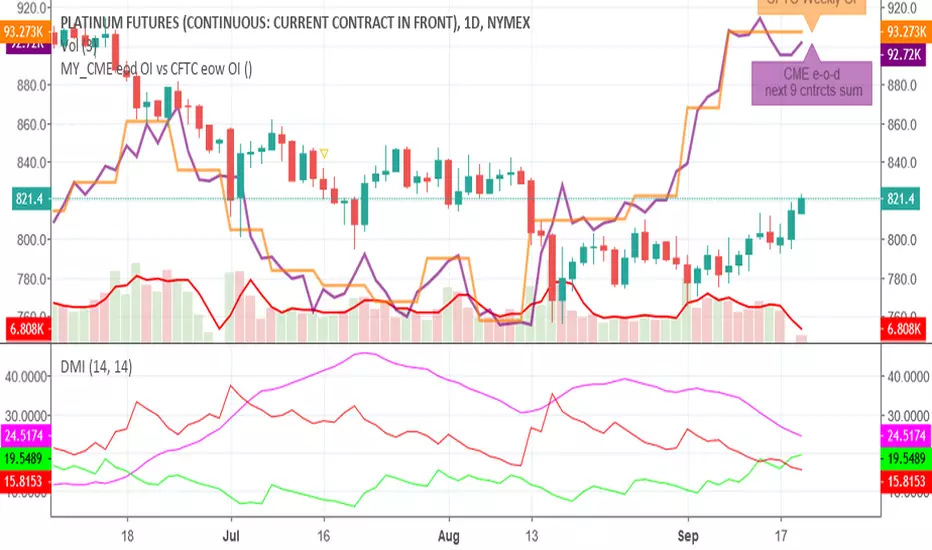
2018/09/18 Platinum Open interest and priceOI going up with price, since it touched its overall minimum, lower than Jan 2016
Platinum future (PL) Platinum price can reach 1000 level sooner according to my analysis.
All we need to get profit is to buy with good money management and hold it.
...
30% of platinum is used for Jewelry.
43% of platinum is used for automotive.
And other 27% is used for several purpose.
...
South African miners are the biggest source of platinum.
..
70% - South Africa
11% - Russia
7% - Zimbabwe
12% - other countries
....
the rise of electric cars reduce the demand of diesel engines, so platinum miners in South Africa cuts thousands of jobs.
As a result. the platinum price fall.
...
But , new source for demand of platinum will be found sooner so the price can reach normal level in this year.
I stand for up trend.
...
Thanks.


Platinum Futures PLV2018 , D1Trading Signal
Long Position (EP) : 827.9
Stop Loss (SL) : 815.2
Take Profit (TP) : 863.3, 899.6
Description
PLV2018 formed Double Repo Buy at 1d time frame. Trade setup with Buy Stop at 0.382 Level (827.9) and place stop after 0.618 level (815.2). Once the position was hit, place take profit before an agreement (863.3) and 899.6
Money Management
Money in portfolio : $48486
Risk Management (1%) : $484.86
Position Sizing
$0.1 = +-$5 (Standard)
Commission fee = -$2.37/contract (Standard)
EP to SL = $12.7 = -$635/contract (STD)
Contract size to open = 1 standard contracts
EP to TP#1 = $35.4 = +$1770 (STD)
EP to TP#2 = $71.7 = +$3585 (STD)
Expected Result
Commission Fee = -$4.74
Loss = -$635
Gain#1 = +$1770
Gain#2 = +$3585
Total Gain = +$5355
Risk/Reward Ratio = 8.37

Platinum with a lot potential to the upsideAnyone familiar with the Commitment of Traders Report knows that the commercials have reached an extreme range that leaves much room for rising prices. Added to this is that the chart image with the recently formed double bottom looks bullish.
This is what a trade might look like:
- Entry immediately
- Stop Loss below the last local low
- Take profit with multiple exits (scaling out) first profit taking at $875

Platinum Futures Elliott Wave AnalysisI'm new to commodities and relatively new to Technical Analysis. No associated fundamental Analysis has been undertaken on Platinum.
This analysis is shared simply to further my own education and hopefully someone will appreciate it.

New trend or old trend?If Platinum passes resistance level of 910 new trend might pick up towards 950 - 1000 with new support level.
If finds resistance at 910 will go down towards 900.


Standard Channel Down and new Lower HighPlatinum is trading on a long term 1W Channel Down (Highs/Lows = -12.1143, B/BP = -36.7780, MACD = -13.210) that started off in late January and has just priced the latest Lower High near 915. With 4H neutral (RSI = 50.443, Williams = -46.789) around the blue line, we expect the decline to a new Lower Low to start soon. The TP is at least the previous Lower Low at 877.90 but more risk averse traders can book the profit earlier ay 893.40.

Platinum cheap relative to PalladiumIt's rare for Platinum to fall below the price of Palladium. Perhaps a Platinum buy opportunity

Prince Harry chooses platinum!Possible Wolfe Wave on watch.
Bottom fishing and trend fight for this high risk but possible high reward pattern.
Confirmation needed.

Platinum Set to Bottom - Time to position LongThis week the COT report for Platinum has a interesting story to tell. Please click here. www.screencast.com
This is a 4 month view of Commercial activity in Platinum Futures. Factoring in a weighting and volatility component, we measure participant positioning and activity and then score this on a 18 month and 5yr basis. This is reflected as a Relative Strength Score from 0-100%.
Notable points here:
1 - Commercial Net Position scores a 91% on a 18m basis.2 - Commercial Longs @ 19,708, score 100% on a 18m basis.3 - Commercial Shorts of (33,473) score a 84% on a 18 month basis.4 - We see that this accumulation has occurred on a continuous basis over the past 4 months, as price has dropped from over 1,000 to below 900.
We now measure price dispersion for every instance where Commercial net position scored 90%+ on a 18 month basis. www.screencast.com
What we see is that on a 20 day forward interval, 70% of the time price advances $27.50 vs declines of only (16) for odds of 7:4 in the bulls camp. The baseline 70% movement of Platinum going back to 2004 is $24 up vs (20) down, so we see distinct out-performance as odds have improved from 6:5 to now 7:4.
Further adding to the favorable odds is that we are approaching the seasonally strong period. Going back to 2000, the months of July + Aug have seen a 61% winning percentage with the average combined price advance of 8% over that period.
The next point we want to highlight is how Platinum has traded during the past 18 months. Please click here: www.screencast.com
We can see that Platinum has been range bound over the prior 18 months. What is interesting to note is how it behaves at the bottom of it's price cycle. What we see is that declines end on sharp down trading weeks with significant increases in volume. Standard Technical Analysis theory will flag this as a confirmation of trend continuing, and encourage more shorting here, which is exactly what trend following algos are doing. However, we can clearly see that this type of price action has been marking bottoms like a clock.
As a final note, with 70% of PGM production coming from South Africa, there is large geo-political risk to future production. Currently there are threats of government takeover of mining assets, upcoming wage negotiations with labor unions, as well as a silent genocide of South African farmers taking place. This is not the backdrop we'd want to be short of the platinum metals group.
Conclusion
As technicals are all extremely bearish, and we don't want to fade this strength, wait for some indication of price reversal before entry. A close above 893, the May 2 low, will give first indication of a bear trap, as all of those shorting the breakdown from 2 weeks back will be hit with quick losses. www.screencast.com
Unfortunately there is not a liquid options market to hedge here, so we would use smaller position size and wide stops as a strategy. Go long at 893, using 860 as a stop. Unfortunately there is not a liquid options market to hedge here, so we would use smaller position size and wide stops as a strategy. Go long at 893, using 860 as a stop. Look to ride the position higher throughout the summer for $90 or better, giving you 3-1 R/R.
Alchymist
Do you know the odds of each bet you make in the futures market? You can. www.3ptcap.com

PlatinumChart looks good. Heaviest Volume profile is sitting in the range where it is being traded rn. BB bands are looking towards a squeeze. I'm in.