TOKENFI #TOKEN Trade alertPlay the bounce for a short term target trades from this clear support block with the deviation low already in place.
For long term believers good area to DCA to bring down your average cost.
TOKENUSD trade ideas

TOKEN: $0.02 | Another Opportunity of a Lifetimea disruptor or venue for fresh assets funds and projects
to feast on
we have great perf from Goldfinch Rio Mantra Axelar etc..
however this one is under rated artificially depressed for
a moment to be rewarded to those who get volume at sub $0.033 cents
strategy: DCA in May and JUNE
Tactic: if u missed out Upsize fomo in AUGHOST dips
Sit back and enjoy the Cicrcus onwards

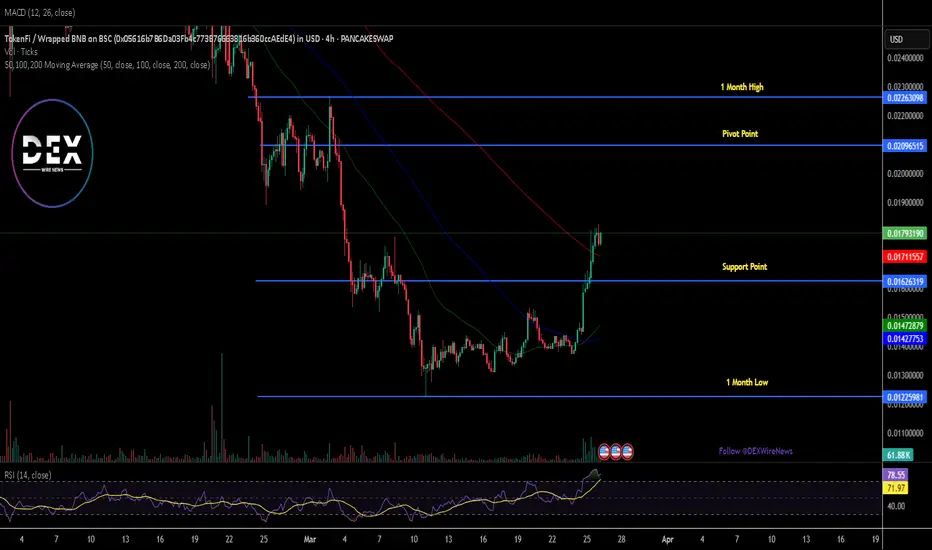
Breaking: TokenFi ($TOKEN) Surge 11%, More Gains Ahead?TokenFi ($TOKEN) a project that aims to simplify the crypto and asset tokenization process and eventually become the foremost tokenization platform in the world has seen its native token surge 11% today breaking loose from a consolidation zone.
A token that once surged to about $200 million in market cap before retracing to $18 million market cap is gaining traction, albeit listed on major exchanges like Kraken, Bybit, Gate.IO, MEXC and quite a number of exchanges- with the market cap at $18 million, this proffers early opportunity for traders to capitalize on the dip as a run to a $100 million market cap is feasible.
For $TOKEN coin, a break above the $0.020 price pivot could spark a bullish renaissance for the asset. Similarly, should the asset consolidate, the 61.5% Fibonacci retracement point is a suitable level for a cool-off before picking liquidity up.
About TokenFi
TokenFi aims to simplify the crypto and asset tokenization process and eventually become the foremost tokenization platform in the world.
The tokenization industry is projected to be a $16 trillion industry by the year 2030. BlackRock, the world’s biggest institutional investor with $10 trillion of assets under management, strongly believes in the industry’s potential, which they call "the next evolution in markets”.
TokenFi is launched by the highly experienced and connected Floki team that launched the popular Floki token that went to an ATH valuation of $3.5 billion. They will be leveraging this same experience to make TokenFi the number one tokenization platform in the industry.
TokenFi Price Live Data
The live TokenFi price today is $0.018083 USD with a 24-hour trading volume of $14,220,544 USD. TokenFi is up 9.69% in the last 24 hours, with a live market cap of $18,083,753 USD. It has a circulating supply of 1,000,019,789 TOKEN coins and a max. supply of 10,000,000,000 TOKEN coins.
TokenFI - Tokenfusd - Bullish Outlook / Read the analysisHi Traders,
Here is an extended analysis of TokenFI on the daily chart.
We’re observing a symmetrical triangle that has been forming over the past three months, which broke out to the downside on June 13, 2024. The target for this symmetrical triangle pattern is between 0.02380570 and 0.02130264, aligning with the Fibonacci targets.
However, there’s also the formation of an inverted head and shoulders pattern, with the right shoulder currently forming. For this bullish scenario to remain valid, the price should not drop below 0.04442998, ideally staying above 0.051155033. These levels correspond with key Fibonacci retracement levels of 0.5 and 0.618. If the price breaks out (ideally with volume) above the neckline, the pattern is confirmed. We can then wait for a retracement back to the neckline or remain in the position as long as the neckline is not breached.
I have also considered the RSI and other macroeconomic factors in this scenario. Additionally, since the beginning of August, we’ve seen an increase in volume accompanying the price rise, which adds another bullish element to the setup. Given these considerations, the overall outlook looks promising, especially with the potential support from the inverted head and shoulders pattern, as long as the stop levels aren’t breached.
If we consider the BTC halving cycle as an additional bullish catalyst, the inverted head and shoulders pattern could very well play out.
In summary, as long as the price stays above 0.04442998, the bullish outlook remains intact. I would place a protective stop at 0.040. If the price falls below 0.033611912, it could drop further to the symmetrical triangle target of 0.0230 & 0.0210 and potentially as low as 0.0150.
The target for the head and shoulders pattern is 0.18288831 if the price breaks above the neckline.
The targets in that case would be:
0.084
0.105
0.135
0.165
0.182
0.250
Happy trading and good luck!
Disclaimer: This is my personal analysis and should not be taken as financial advice. Always conduct your own research before making any investment decisions.
