TOMOUSD BIG head and shoulderBIG head and shoulder is creating.
Target price is below 0,20 usd in next months.
It is so depressive.
TOMOBULLUSD trade ideas

TOMOUSD shortermI see 1,60 usd in short term. Very fast growth in one minute is finished.
Price wll back to 1,30 usd and I see this level like next chance to accumulation TOMO.

TRBUSD price will fall to 1 usd?We have bearish engulfing on weekly.
Price declined 30% 4 days before.
While most coins are rising, TOMO is falling which is a very bearish sign.
This is end of this cycle of growth.

TOMOUSD to 6 usdAs we see, W pattern is here (consolidation).
Triple top does not exist (my prior chart). My target price is 6 usd.


TOMOUSDWhy price of TOMO will fall to 1,3 usd and more?
We have bearish pattern, rising wedge, first target 1,3 usd. Now, we have triple TOP what it means 1 usd will be price very soon....

TOMOUSD triple topI see triple top on daily chart with possible target of 0,80 usd.
Last support is at 1,00 usd.

✴️ TomoChain After A Massive 895% Bullish Wave, What Now?Having a unique chart is always a positive, as I've mentioned multiple times in the past. Seeing unique patterns/price action/movements, it is great because it tells about the people behind the project and/or its supporters... There is something going on here that is not based only on bot trading.
When you see the exact same chart, it means that most of the trading is done by bots and people can only get in and out of a predefined trend.
TomoChain has been doing great.
Straight up; From December '22 through May, an amazing 895% bullish wave.
The correction that followed, small and today we see all the signals that support additional growth. Getting straight to the point, the next jump can lead to 160% from the current price. 67% in the really short-term.
Now, let me show you some of the signals to support the assumptions made above.
First, the MACD:
Ultra bullish. It went below zero but it is back above it and printing a bullish cross, just now.
This bullish cross is really potent as the histogram can be seen turning green. Just being above zero is a bullish signal so here we have a mix of these. Multiple signals together work better than one.
The RSI:
Zero here would 50.
TomoChain daily's RSI is trading above 60, so super strong.
The local downtrend has been broken, the orange trendline and this opens the possibility for growth.
That's it for the indicators.
The main support is set at 1.18.
- Any trading above this level is super bullish.
- Below this level things can change.
You define your own everything... This information is for experienced traders. If you are a beginner, do your research, study long, practice and then play... Or jump in right away. Whatever you do is up to you.
Thanks a lot for your support.
Thank you!
Thanks!
Namaste.

tomo large reward large slTomo is in a nice pattern with a solid 1.50 target and 1.00 support for the most part but this coin is very volatile and getting stopped out a few times trying to get the shot is likely

TOMO SHORTRESISTANCE LOOKS TO BE TO STRONG TO BREAK rsi is almost exhausted on the 4hr only problem is this is a very volatile pair and sl could get hit Target 1.25 sl 1.56 entry 1.47

TOMO - longWe are almost reach to Potential reversal zone ( highlighted in green).
PRZ fall between 0.799 to 0.78 as shown in the chart.


Add managed risk to Tomo positionHey again GG. Please first Look at Related idea.
The previous analysis has not yet failed.
And the yellow zone was able to pull the price towards itself again. This is a magnetic field. When drawing the arrows related to elliott waves, no time analysis was performed and only the predicted path was drawn. I may take action (including adding volume) against the old trading rules (under resistance). So DYOR.
Do you think the price of Tomo is expensive now and should experience another fall? Okay, let's see. I'm a little doubtful.

TOMO 4h ShortSetup: TOMO is in a downtrend. It is also respecting the 50 EMA and got rejected off it.
Entry: When MACD crosses down
TP: 1.27835
SL: 1 ATR above 50 EMA

TOMO Bearish Rising Wedge ScenarioLabelled points a,b,c correspond to each other
inverting point a gives a nice comparison
Rising wedges are usually a bearish pattern, but lately I have seen some breaking out bullishly
regardless, this one seems bearish

Tomochain big cup and handle patternTomoChain is currently creating a cup and handle pattern with 2 cups

Tomo is looking extremely bullish As you can see tomo is producing yet another cup and handle pattern on the daily candle chart.
Next prices:
1️⃣ 3.360
2️⃣ 3.560
3️⃣ 3.813
4️⃣ 4.200
5️⃣ 4.567
Stop-loss: 2.880

Tomo is a shark or cypherit seems fake break of 1.6BC and 1.13XA in the median line resistance area.
AB=0.61 XA
BC=1.13 AB
0.78 XA=$1.27
0.88 XA=$1.67
1.6 BC=$2.94
1.13 XA=$3.26
2 BC=$6.27
1.41 XA=$7
2.24 BC=$10
1.6 XA=$12.5


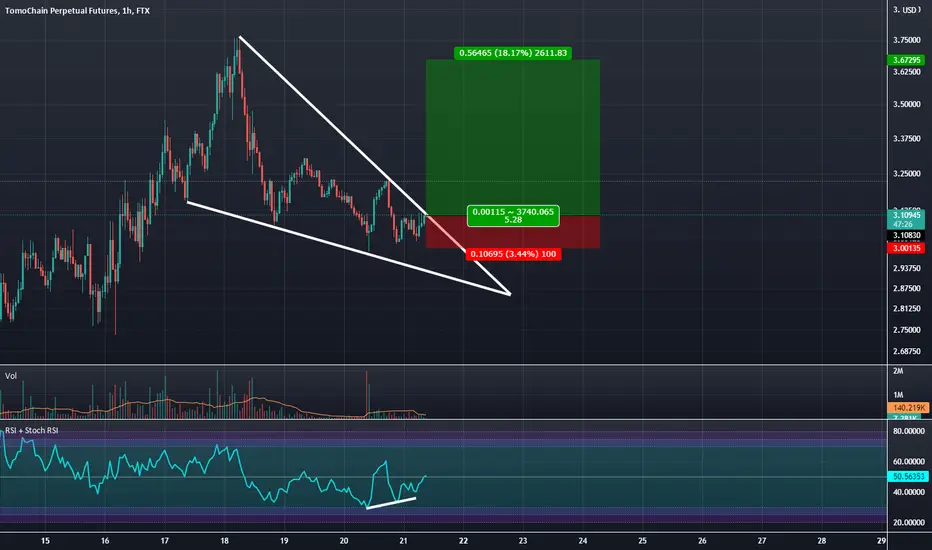
TomoChain: Falling Wedge Breakout.There is a Higher Low Double Bottom going on here with some Bullish Divergence on the RSI and the RSI going over the 50 line as we Breakout of this Wedge. My target will be the .886 retrace
Bearish Bat At PCZ Near Market Close on TOMOCHAINThis will be a quick trade if it plays out but if it goes above the X point i will be exiting my hope for this trade is that we get a nice bearish reaction before the Sydney Session.

$ TOMOUSD Daily $ Consolidation BreakoutLong TOMOUSD
$ TOMOUSD Daily $ Consolidation Breakout
Keep an eye on this pair if closes above 2.90 then we can expect a target of 3.90
Note: Do your own research before buy
Thanks <3

TomoUsdttomo reacted to the bottom of its ascending channel. I think we will see good growth.
it seems bullish.
