TOMOUSDT | PARALLEL CHANNELTOMOUSDT has been trading in bullish parallel channel .
The price is printing higher highs and higher lows.
The price is currently trading at upper boundary of channel.
There is a confluence point having horizontal resistance too.
It is trading at an important zone.
The bears will get control in this zone.
Manage your levels accordingly.
TOMOUSDT trade ideas

TOMO/USDT-30m-BINANCEThis is not a financial advice. Always do your own research and always put stoploss in your trade (SL) :) If you want more detailed info
how to study and read charts or just need help with some coin, just write to me here a comment, i will try to answer to everybody...
i can help you :) all for free, don't worry, BE HAPPY!

TOMOUSDT is at the bottom. Send it!!Buy this gem and you will have 50x in 2-3 years.
The graphic shows as it is holding at a strong position, from which we can depart.
Risk: High
Return: 2x-3x in 2 months at most

Why 0.225 is the bottom?1) it is the final target of the ABC Cypher harmonic pattern on the top: 2BC
2) it is the 0.78 Fibo retracement level
3) it is the 1.61 Fibo retracement level of the fourth(iv) wave and it is the fifth(v) wave.

TOMO - Critical areaHello, dear TradingView members.
This is a TOMO idea.
TOMO's price is in a critical area.
If the middle support line (in red) holds the price up, we can consider this a bullish breakout.
If the price falls from this level, it will continue its bearish trend in the regression.
RSI is overbought, and the price has more room to go up.
If you guys have any other perspectives, let me know. I'm really interested.
Now let's see your ideas. Let's have a discussion.
Let me know if you guys have any questions;
I will be more than happy to help.
Good luck, and thank you.

TOMOUSDT...why so serious?#TOMOUSDT
TOMO is going slowly to the top...very slowly!
the graph is clear, no further explanation needed... the level 0.3500 is LOADING
#stay_safe

TomoChain Bullish - Next TargetCurrent Market Price, 0.33
Buying Range, 0.30 to 0.33
TP Rang 0.40 0.47 0.53
SL Rang 0.27
R/R 4.04
As new traders here, we're waiting for your feedback. Please like and comment on our ideas, and feel free to ask any questions in the comments. We'll do our best to respond to them all.
We wish you all a nice day and success in your trading today!

TOMO | Seems like Ready to FLY..!!
#TOMO Looks Promising for Midterm.
Falling Wedge & Double Bottom Formation in HTF.
RSI is Printing Bullish Divergence as well.
Bulls need Strong Volume for Wedge Breakout.
Please like the idea for Support & Subscribe for More ideas like this and share your ideas and charts in Comments Section..!!
Thanks for Your Love & Support..!!

TOMOUSDT - 1hchart - Targets and StoplossHello everyone, let's take a look at the 1H TOMO to USDT chart as you can see the price is moving above the local uptrend line.
Let's start by setting goals for the near future that we can consider:
T1 - $ 0.4382
T2 - $ 0.4555
and
T3 - $ 0.4782
Now let's move on to the stop loss in case of further market declines:
SL1 - $ 0.4244
SL2 - $ 0.4143
SL3 - $ 0.4065
SL4 - $ 0.3988
and
SL5 - $ 0.3877
Looking at the CHOP indicator, we can see that in the 1H range we have more and more energy, and the MACD indicator shows a local downward trend.

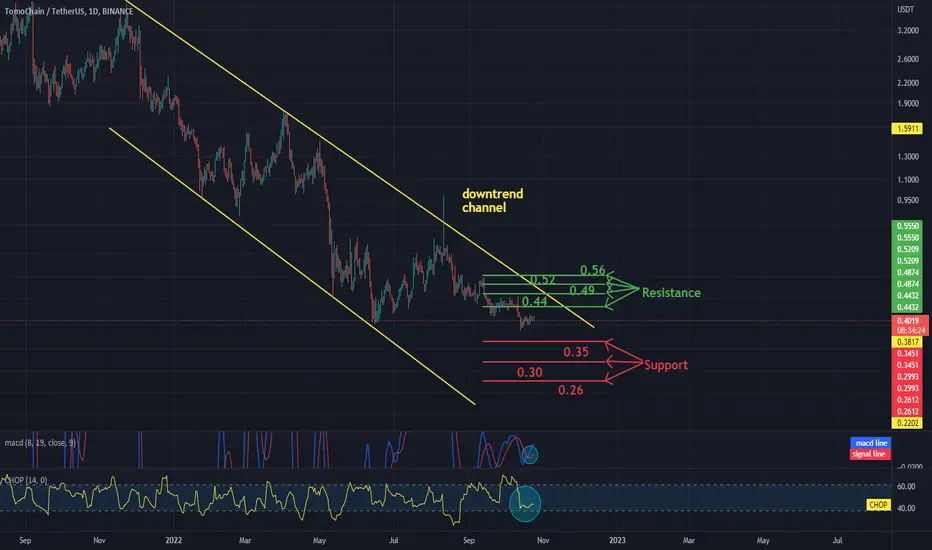
TOMOUSDT - 1dchart - resistance and supportHello everyone, I invite you to review the TOMOUSDT chart on a one-day interval, as you can see the price is moving in the downtrend channel marked by yellow lines.
It can be noticed that currently the price is on the spot of the June low and is slowly starting to accumulate.
Now let's move on to drawing a resistance line that price has on its way, and as you can see, the first resistance is at thirty-five cents, the second resistance is at thirty cents, and the third resistance is at twenty-six cents.
Then we'll look at what resistance TOMO has in its path when it starts to rise, and as you can see, the first resistance is forty-four cents, then forty-nine cents, the next one is fifty-two cents and fifty-six cents.
It is worth paying attention to the CHOP index, which indicates that energy has been used and is in the accumulation phase, and the MACD indicator indicates a local upward trend.

huge risk huge gaini think this is what theey called reversal guys... tomochain is 5 years old coin and they know how to play the game. it's time to show some strength over against bitcoin

Looks like ready to goI can imagine a breakout at this point, it looks like at least an intermediate bottom
TomoChain (TOMO) - hidden bullish divergenceToday’s idea is incredibly similar to the ENS idea published yesterday.
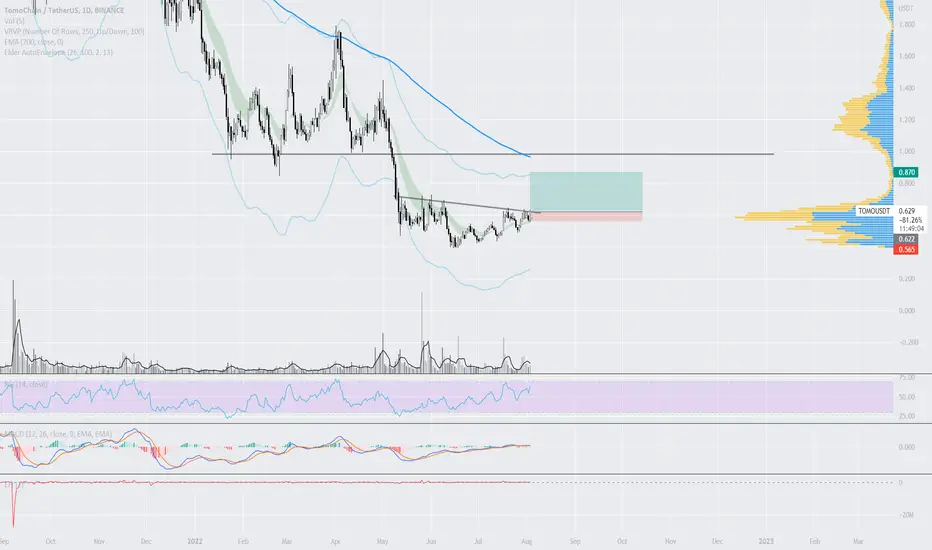
On the above 2-day chart price action has corrected almost 80% since last November. A number of reasons now exist to be long, including:
1) Double ‘incredible buy’ signals.
2) Regular and hidden bullish divergencies. Amazing.
3) A higher low prints on the golden ratio. Fantastic.
4) The 2-day TOMO / BTC pair (below) also fulfils points 1-3 above with the 5-day printing a buy signal.
Is it possible price action falls further? Sure.
Is it probable? Very unlikely.
Good luck.
Ww
PS: Recently a number of messages days / weeks after publishing ask if it still a good time to get in or should they wait. Don’t let emotions get in the way, act now.
2-day BTC pair
5-day BTC pair

TOMOUSDT AB=CDAB=CD
The AB=CD pattern is easy to identify on charts and consists of 2 equivalent price legs. It has specific Fibonacci measurements of each point within its structure, eliminating room for flexible interpretation. The C point must retrace to either a 0.618 or 0.786 and the BC projection is either 1.27 or 1.618. When the BC projection and the AB=CD completion converge closely and define a small area, the chance of a reversal increases.
The first target would be the 382 retracement of AD and the second target the 618 retracement of AD. A common stop level is behind a structure level beyond the D point. Conservative traders may look for additional confirmation before entering a trade, for instance an aligning RSI value or a specific candlestick pointing at a reversal. TradingView has a smart ABCD Pattern drawing tool that allows users to visually identify this pattern on a chart. There are several variations, based on CD being an extension of AB such as the 1.27 AB=CD or the 1.618 AB=CD pattern.

TomoChain Analysis ;TOMO/USDT Update 📈📉HEY, what's up guys and girls ?!
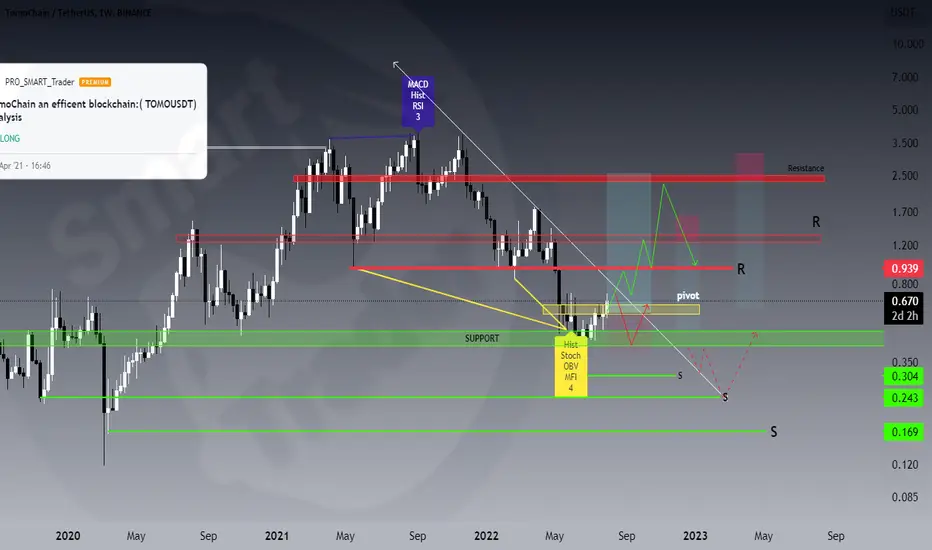
Since 03 Apr 2021, when I posted the last analysis for TomoChain , it has been declining till now .
although I expected a possible rising for it ,but due to market condition wasn't able to see higher
targets and decreased!
So today as you see on the weekly timeframe again for TOMO/USDT ,after a little consolidation phase It recently Re-bounced exactly on the last demand zone! As long as it is above two key support and pivot zone , we can hope for an upward scenario at least in the short or medium term , also the current candle seems that has the power to overcomes pivot zone so then should also breakout the descending trendline , and less likely may get rejected there ! but if it be able to overcome this resistances then can see higher R zones and likewise , by the way it will likely get rejected again from one of these R resistance zone .
✌️ Good luck with your trading and investing and remember: Trade smart…OR JUST DON’T TRADE!
--------------------------------------------------------------------------------------------------------------------
👉This analysis is my personal opinion ,not a financial advice ,so do your own research.
💚 if you're fan of my analyses please follow me , give a big thumbs 👍 OR drop a comment 🗯

Tomo to short to next available demand zoneRight now the market is still in a range
No Bos broken but seeing the consolidation at the top touching a resistance level we expect a short from it...

TOMO Could Develop a Downtrend - Cryptoz18█ Operation Information
TOMO has had a strong bullish momentum in the last few days now and the 4H trend is in play, I expect a downside breakout and maybe as soon as I touch the TPM move my SL to entry and progressively move my StopLoss in profit
█ Operation data
• Entry price: 0.5269
• StopLoss: 0.5379 (Loss 2.09%)
• TakeProfit Minimum: 0.5159 (Win 2.09%)
• Recommended margin: 5% of the Futures account
• Recommended leverage: 1x.
• Temporality: 15Min - 4H
✔️ Data: The user is recommended to move the StopLoss to entry once we reach the TPM or also known as the Minimum TakeProfit.
In this way, if the trend is good for a longer timeframe, it will never touch the StopLoss placed on our entry. We will only have to pay the commissions in case we get the SL at the entrance.
Being a 15-minute trade looking to take a 4H trend it is likely to have a fairly low Winrate due to the tight StopLoss however this offers us better risk management. We try to take a 4H trend using SL and TPM of 15 minutes.
This way, we seek to obtain a profit of 100% between all operations. Only 5% of the account per operation could achieve our objective and thus obtain a return of 5-7% per month of the total account. This will be reflected at the top of our profile.
]█ Explanation of how the operations work:
Here you can find a brief explanation of how the operations work in case you are interested in following them.
█ Warning
✔️ Blockchain or FX operations represent a high risk. Therefore, this operation should not be taken as an investment recommendation. All I do is share my trade ideas publicly for the viewer to do their own analysis and decide to enter based on her own decision making. The viewer is recommended to have good risk management in their operations. To do this, take into account the fundamental data of Asset Volume, Market Capitalization, Supply, Percentage Change Price, Current Volatility, Perpetual Data, and lastly, proper Margin and Leverage management. Be careful, you can lose all your money in the future if they have poor risk management. Nothing more to say thank you very much.

#TOMO/USDT 3HR CHART UPDATE !!Hello, community members welcome to another chart update.
If you find this update helpful, shoot the like button follow and share your views in the comment section.
TOMO/USDT broke above the triangle pattern and moving upside we can take entry at CMP and place orders below if it comes down to retest at a range between $0.4830.
ENTRY : CMP AND ADD MORE TILL $0.4830
TARGET : 30% - 35%
STOP LOSS : $0.4570
Use low leverage 5x - 7x .
You can hold this for mid-term gains.
NOTE: This is not financial advice. This is for education purposes only. I am not responsible for the profits or losses you generate from your investments.
DO YOUR RESEARCH BEFORE MAKING ANY TRADES.
Thank you.


TOMO/USDT shortToday we are exploring the possibility of a short on TOMO, whilst applying leverage to take advantage of a potential dip in the instruments value:
Entry: 0.484
Targets: 0.48 - 0.4755 - 0.4705

Buying $TOMO Here TOMO opens 1D chart we can see price is stopping falling. The reason is supported by the Fib(1.618) determined from the pivot point.
This is a good zone to buy and hold. it will be back to $0.6 very quickly
At the moment we are buying, the RSI is also showing bottom convergence - a sign of buying volume accumulation.
