TomoWeekly rsi. That is interesting. Anyway wait for break out and Stay on top of the line. Be careful because this line can act as a resistance.
TOMOUSDT trade ideas


TOMOUSDT CUP AND HANDLE PATTERN
Hello all,
TOMO is one the project that I am looking at. I think that it could form a CUP & HANDLE pattern TA-wise.
I think that this project could go beyond 5$, if BTC will get to new ATH´s this year.
NFA as always.
Cheers

TomoIn this chart, channel is important, so set stop loss and buy step by step. Target = 3$
But everything depends on the btc and I guess it is ready for break up. Share for your friends.

#TOMO/USDT 4HOUR UPDATE BY CRYPTOSANDERS Welcome to this quick TOMO/USDT analysis.
I have tried my best to bring the best possible outcome in this chart.
Hello members welcome to TOMO/USDT quick update by crypto sanders
As we can see that TOMO/USDT was trading inside the triangle pattern and broke the upper trend line.
In the current scenario, TOMO is moving down to retest the upper trend line and yellow MA is also working as support.
Currently, tomorrow is trading inside the green zone which is the zone to go long on the spot or low leverage.
we are expecting more than 50% profit here without leverage.
entry:-$1.24,$1.30
target:-60% to 70%
stop-loss:-$1.18
Sorry for my English it is not my native language.
Remember:-This is not a piece of financial advice. All investment made by me is under my own risk and I am held responsible for my own profit and losses. So, do your own research before investing in this trade.
Do hit the like button if you like it and share your charts in the comments section.
Thank you.

$TOMO will give a FOMO$TOMO:
IMO :
The red zone might be the area $TOMO wants to break to move up.
Possible Scenarios :
1. If it breaks up the red zone., It might move up towards red dotted (Bullish reversal).
2. If it fails to breaks the red zone., It might oscillate in the yellow zone (Good area for Spot accumulations).
3. If it fails to break the red zone & fails to break the Yellow zone., It might dip down to touch the Black dotted line where a
high chunks of volume needed for a massive pump.
Any opinions guys ?
Happy trading

#TOMO #Tomochain #Bitcoin #blockchainGiven the support in the range 1.12-1.14, I expect growth to the range 1.43-1.48.
Next resistance: 1.62-1.70
This is just a personal view, not a buy or sell signal.

$TOMO, Volume rising, same W pattern across the board$TOMO
Signals keep flowing in
Volume rising, same W pattern across the board
Willing to see if it can hold the HH around ~1.3$, If happens then we can look for continuation
#TOMO
🆓TomoChain (TOMO) Mar-03 #TOMO $TOMO
The buying power of TOMO is very strong, however it is currently facing strong resistance at the $1.5 zone. Over the next few days it could correct to the $1.3 and $1.2 zones before rallying back towards the $1.6 and $1.9 zones.
📈RED PLAN
♻️Condition : If 1-Day closes ABOVE 1.2$ zone
🔴Buy : 1.3 - 1.2
🔴Sell : 1.6 - 1.9
📉BLUE PLAN
♻️Condition : If 1-Day closes BELOW 1.2$ zone
🔵Sell : 1.2
🔵Buy : 1 - 0.85
❓Details
🚫Stoploss for Long : 10%
🚫Stoploss for Short : 5%
📈Red Arrow : Main Direction as RED PLAN
📉Blue Arrow : Back-Up Direction as BLUE PLAN
🟩Green zone : Support zone as BUY section
🟥Red zone : Resistance zone as SELL section

TomoChain (TOMO) Bullish BreakoutTomoChain (TOMOUSDT) closed above EMA50 daily.
Additional growth possible.
We have a falling wedge and bullish indicators (MACD & RSI).
The trading volume is still low but we have a higher high compared to mid-Feb., which supports the bulls perspective.
Namaste.

TOMOUSDT - Long - Potential 43.62%TOMOUSDT - Long - Potential 43.62%
Exchanges: Binance, KuCoin, FTX
Signal Type: Regular (Long)
Entry Targets:
1) 1.145
Take-Profit Targets:
1) 1.251
2) 1.399
3) 1.631
Stop Targets:
1) 1.004
Entry Trigger - Active breakup- nice volume, money finding alts, stoch. testing oversold. May retrace to weekly pivot at 1.033 if rejected at 200EMA.

LongThe price move in the side channel. In the long term may be raise the price & move to the top of the channel

TOMO/USDT Analysis 1DTOMO showing rejection after hit on strong support zone
RSI Bullish divergence
Good setup for entry
Target mentioned on the chart
Stoploss : $0.94


The TOMO price dropped to the support area.Hello everyone, let's take a look at the 1D TOMO / USDT chart.
We can see that the price is constantly moving under the downward trend line and is currently in a place from which it has already rebounded several times.
Let's move on to the designation of the support lines. As you can see, the first support is at $ 0.95, just above it is the current TOMO price, if the price breaks it, the next support is at $ 0.671
It is also worth determining the resistance that price is facing in the event of increases. Here we find the first resistance at the price of $ 1,279, while looking further, we can find the resistance at the price: $ 1,470, $ 1,629, $ 1,787, $ 2,011.
In the CHOP indicator, we can see that the energy has run out and we shouldn't have a lot of movement right now.

Tomousdt pair to 3.7Important time slot today
According to the principle of analyzing numbers, these trends and curves have emerged and are important and respected by the price as we see

Tomo 🔥⚡ $TOMO #TOMOTomo has been in a box for 395 days and is in a state of suffering. It has moved back and forth from the $ 1 floor to the $ 3.6 ceiling and is now heading for the box top for the third time, breaking a 77-day downtrend line. If it can finally break the box roof, it can grow to the limits it has drawn.
I hope you find this analysis useful🌹
Follow for more...
#DYOR

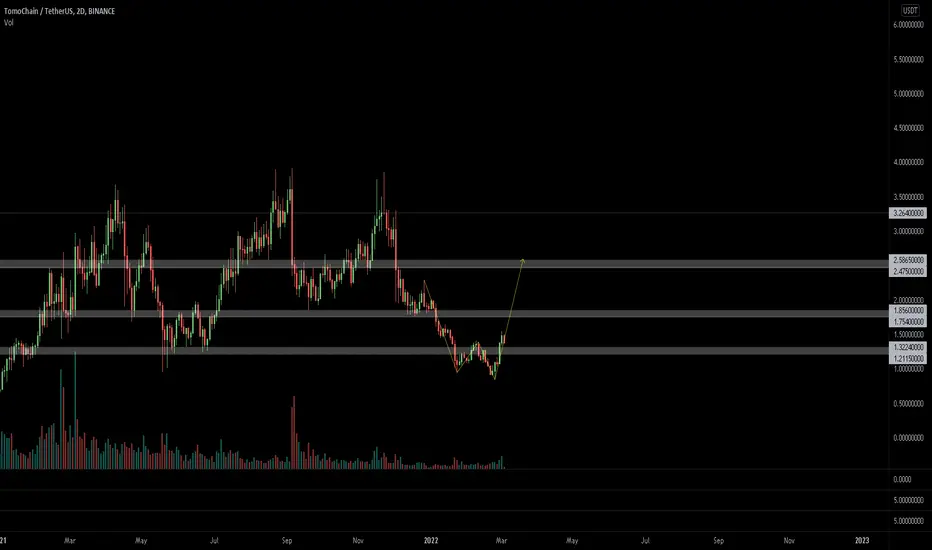
Tomo Range and maybe new bullish Trend startedTomo-USDT touched the dynamic Trend line and also static support zone.
in RSI Tomo broke bearish Trend and started new movement.
distance between the Price and MA 200 is too much & 4 days close price are above EMA 20.
So i think its time to buy for midterm and also long term investment.
in Midterm it seems to be easy to reach zone 2.5 $.
#DYOR
also don't forget to watch my analyze of TOMO-BTC chart!
maybe it will be a super X Trend. something like Solana or SHIB
good luck
feel free to share your comments and opinions. BINANCE:TOMOUSDT KUCOIN:TOMOUSDT FTX:TOMOUSD

TOMOHi Dear traders, this is my opinion, and I think TOMO will go for the targets that I have mentioned in the chart. You can use it for futures trading with a 20x leverage. Be sure to use stoploss exactly on 1.226205. I am going to open my position too. Good luck, and please do not get greedy!


TOMOUSDT Update !!The confluence of the technical resistance with the Fibo level 38 constitutes a difficulty to penetrate

tomo/usdt A double top is an extremely bearish technical reversal pattern that forms after an asset reaches a high price two consecutive times with a moderate decline between the two highs. It is confirmed once the asset's price falls below a support level equal to the low between the two prior highs

