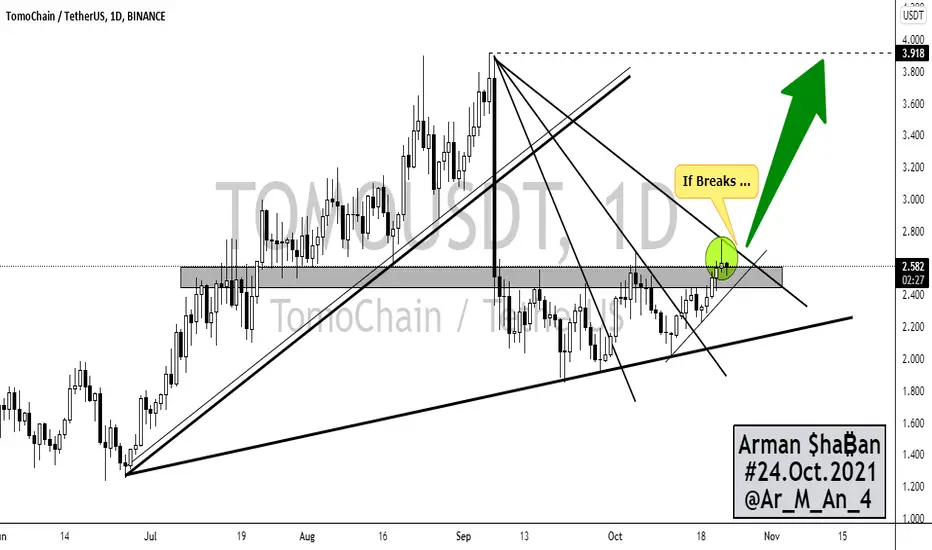
₿ TOMOUSDT 1D ₿ : 24.Oct.2021This analysis is a check of the chart in a Daily time frame and everything is clear on the chart and does not need additional explanation ... However, if you have any questions, feel free to ask . My personal opinion : Personal review to buy (Buy Recommendation)
⚠️ This Analysis will be updated ...
👤 Arman Shaban : @Ar_M_An_4
📅 24.Oct.2021
⚠️(DYOR)
TOMOUSDT trade ideas
TOMO/USDT LONG term analysis TOMO/USDT LONG term analysis
based of retracement of price, below the 2.5$ -2.7$ is good for entry as along term investment ( At least 3 to 12 months )

TOMO/USDT TRADE SETUP!Hello everyone, if you like the idea, do not forget to support with a like and follow.
TOMO looks good here. Already broke out of the cup and handle pattern and currently retesting it. Buy some here and add more in dips.
Entry range:- $2.4-$2.45
Target1:- $2.52
Target2:- $2.62
Target3:- $2.70
Target4:- $2.82
SL:- $2.3482
Leverage:- 3x-5x
If you like this idea then do appreciate it with like and support.
Also, share your views in the comment section.
This isn't financial advice. DYOR before investing.
Thank You!

TOMOUSDTTOMO USDT in bullish in 4 hour time frame we can see the golden cross over.tomo will break the supply zone.the accumulation period is over i think.(educational purposes only)

tomoThe tomo currency is in a good position, and if it can overcome its own static resistance, which also overlaps with the Moving 200, it can grow well.

TOMO - RR 1:4 - DO YOU WANT TO TRY?Since the peak and then a strong discharge candle. The Tomo price is in free fall and sideways for quite some time. It's time to make a break.
1. The price will break up and find the old top again.
2. There will be a false breakout. Formed a double bottom and then continued up.
Target: 3.7$

TOMO GAINS COMING?TOMO has been in a downtrend for so long and the crash was massive... However, we're now very close to the decision point and I believe TOMO will flip the resistance area soon with the strong divergence showing up on the OBV and price action is also turning bullish!
TOMO Is gaining momentum.
Good long/spot buy area is here $2.3 and targets are all marked.
SL can be below the support line, It shouldn't lose $2!


A three-drive pattern can complete in TOMOA three-drive pattern can complete in this wedge.
SL: Breaking the wedge from the bottom

$TOMO/USDT 1h (Binance Futures) Descending channel near breakoutTomoChain is looking good for a bounce here after regaining 50MA support, more information about that coin on tomochain.com
Current Price= 2.0807
Buy Entry = 2.0857 - 2.0323
Take Profit= 2.2697 | 2.4610 | 2.6433
Stop Loss= 1.8917
Risk/Reward= 1:1.25 | 1:2.38 | 1:3.47
Expected Profit= +20.36% | +38.94% | +56.64%
Possible Loss= -16.34%
Fib. Retracement= 0.618 | 0.883 | 1.117
Margin Leverage= 2x
Estimated Gain-time= 5 days

Is it time to fly?Given the length of suffering, and the government token that Tomo, It is very likely that suffering will end in this area
Good long-term purchases can be made
Just for #HODL

TOMOAlerting TOMO here, the trend lines appear to be getting very tight here. GL guy's big mike loves you.


tomochain doesnt seem to break rectangle with enough strenghif it fails to break rectangle upward , short positions would be better

Tomousdt update by vicSo am waiting for a break above that line(white line) to get the price but any break below you should get ready to go out
Overall structure BULLISH
Minor structure BULLISH
Share and thanks for reading
GOOD LUCK TRADERS


TOMO/USDT nice 30% profit?Support area - daily, trendline, POC. Target zone is strong monthly level with golden pocket confluence. Lets go :)

Tomo inverted head and shouldersif triggered will send price $3.475
This is in line with my previous idea on Tomo.

🆓TomoChain (TOMO) Sep-28 #TOMO $TOMOTOMO has being rejected from the 2.2$ zone so in next days it could fall down to 1.8$ zone, which is a good opportunity to help TOMO bounce back to 2.4$ zone and 3$ zone. But if it loses 1.8$ zone, it will fall sharply to 1.45$ zone
📈RED PLAN
♻️Condition : If 1-Day NOT closes ABOVE 2.2$ zone
🔴Sell : 2.2$
🔴Buy : 1.8$
🔴Sell : 2.4$ - 3$
📉BLUE PLAN
♻️Condition : If 1-Day closes ABOVE 2.2$ zone
🔵Buy : 2.2$
🔵Sell : 2.4$ - 3$
❓Details
🚫Stoploss for Long : 10%
🚫Stoploss for Short : 5%
📈Red Arrow : Main Direction as RED PLAN
📉Blue Arrow : Back-Up Direction as BLUE PLAN
🟩Green zone : Support zone as BUY section
🟥Red zone : Resistance zone as SELL section
🅰️A : The Close price of 1-day candlestick is Above the zone
🅱️B : The Close price of 1-day candlestick is Below the zone


Tomo back to uptrend?!TOMOUSDT start moving up
if tomo can break 2.38 to 2.4$ probably can reach to 2.6 and 3$ channel soon
