TOMO 1H Scalp Long?Do you wanna try scalp long on TOMO? TOMO need to break out 0,95 (local resistance) to launch higher. In this scalp case wait for 1H close and if volumes are good move with the markets and !THE MOST IMPORTANT! put your SL under the last 1H candle. This is way too risky trade bu still can make a good profit if the volumes come.
TOMOUSDT trade ideas

TOMO shorting month range high resistanceShorting prev months high acting as resistance. this level is also resistance from earlier in the year. first target mid of week range

Keep an eye on $TOMO/USDTGetting ready for Bullish Wave $TOMO/USDT
Target mentioned
Noted: Not a financial advisor.
It's always recommended to carefully consider all the factors and conduct thorough research before making any investment decisions. I suggest seeking advice from a licensed financial advisor.

TOMO Bull Flag attempting to breakout TOMO 2x - 3x Leverage ( also available as regular spot trade )
Market Cap: 109M
Category: DeFi
Target 1: 1.1684
Target 2: 1.2736
Stop Loss: 1.0432
Manage Risk - have a stop loss in place
Not Financial Advice
This is for Entertainment Only

Tomo bull pennanttomo is looking strong this weekend and forming bullish pennant. Can be longed on potential breakout.

TOMO breaking out
Ladies and gentlemen, we've got ourselves a rip-roaring breakout in the world of cryptocurrencies, and it goes by the name of TOMO (TomoChain). This digital dynamo has been heating up the charts, ready to ignite a rocket-like move to the upside. TOMO, with its cutting-edge blockchain technology and innovative features, has caught the attention of astute investors looking to ride the wave of potential profits. The recent price action has been nothing short of extraordinary, with TOMO breaking through key resistance levels like a champ. The bulls are charging ahead, fueled by growing market enthusiasm and a surge in buying pressure. Volume, my friends, has been off the charts, signaling strong conviction and participation from traders around the globe. Technical indicators, such as the moving averages, are pointing skyward, painting a picture of a robust bullish trend.
Now, let me be clear, my friends, nothing is a sure bet in the wild world of cryptocurrencies. The markets can be volatile and unpredictable. However, when you see a breakout like this, it's hard to ignore the potential for exhilarating gains. So, keep a keen eye on TOMO as it breaks out, for it could be a ticket to profits that'll make your head spin. But remember, do your homework, diversify your portfolio, and approach this market with caution. Stay informed, stay vigilant, and get ready to ride the wave of TOMO's breakout.

TOMO strong support levelExpecting the breakout of the horizontal level of support. Price has tested it for many times. Volumes are rising with predominance of sellers activity. Open short position only on high activity before the breakout. Target - 0.9020

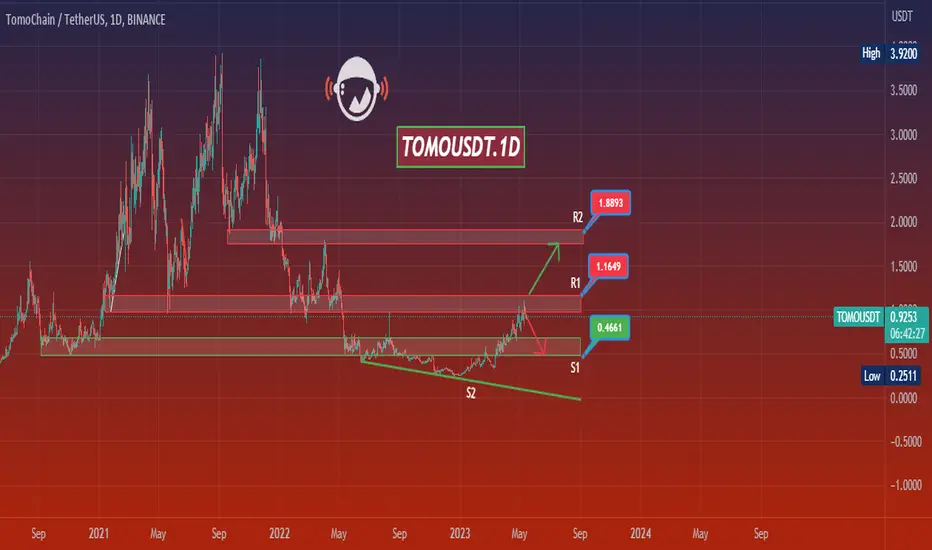
TOMOUSDT.1DHello dear friends,
*Mars Signals Team wishes you high profits*
This is a one-day-time frame analysis for TOMOUSDT.1D
The price is close to its first resistance line and we have two scenarios in mind. Or from these areas the price starts to move towards the first support area. Or it can stabilize above the resistance line and move towards the second resistance line.
Warning: This is just a suggestion and we do not guarantee profits. We advise you to analyze the chart before opening any positions.
Take care
TOMOUSDT 4H#Purchasing offer for the medium term
If the tomo currency is supported in the specified range at the price of 0.9, it has a good position for buying or trading
#tomousdt
buy att 0.9
sl 0.8
tp1 0.97
tp2 1.05
tp3 1.15
tp4 1.23

TOMOUSDTMore than 300% growth in 130 days? It is admirable. But now Tomo has faced a strong resistance. The target of $1 has been reached and I think we have a little drop or at least sideways movement in the coming days.
⚠️ "Daily crypto market analyses I provide are personal opinions & not financial advice. Trading carries risks, so do your own research & seek advisor's help."

TOMO has completed 3. Wave or will complete it very soon.Hi all
TOMO has completed 3. Wave or will complete it very soon. I see two scenarios at his moment.
It's very difficult to decide what it will do right now. So it will be a good idea to wait and see which scenario it chooses.
Regards.

TOMO/USDT Technical Analysis: Bearish Channel Breakout PotentialTOMO/USDT Technical Analysis: Bearish Channel Breakout Potential
In this technical analysis, we will analyze the TOMO/USDT chart and explore its potential bearish movement. It is essential to note that this analysis is not financial advice, and readers should conduct their research before investing in any cryptocurrency.
Current Price:
At the time of writing, TOMO is trading at $0.913.
Ascending Channel Breakout:
The TOMO/USDT chart is currently trading in an ascending channel, which is a parallel channel that indicates a bearish trend if broken downwards. The channel was last broken on March 2, 2023, and resulted in a 23% downside target.
Bearish Potential:
If the support line breaks, we can expect a 44% down move from the current level and a 36% down move from the breakout area. Thus, the bearish potential is significant, and investors should be cautious.
Weekly Resistance Level:
The weekly strong resistance level for TOMO is between $1.20-$1.30, and we anticipate a big rejection at this level.
Key Levels:
Support: $0.82/$0.51
Resistance: $1.10/$1.30
Conclusion:
In conclusion, the TOMO/USDT chart is currently looking bearish, with the potential for a significant down move if the support line breaks. Therefore, investors should conduct thorough research and consider risk management strategies before making any investment decisions.
Follow us for more chart analysis.
Thank you.

Tomousdt 12h time-frame Tomousdt
Facing doubke resistance on 12h time-frame
Breaking down first trendline support I am expecting a retest again incase of again rejection tomo price will drop 20-30% most probably

Don't Miss TOMO Breakdown#TOMO Breakdown and Retest Done! Good SHORT opportunity with proper risk management
Targeting 0.8000

tomousdtsmall trade for tomo we will short here usdt dominance is going up so coin will down for somtime

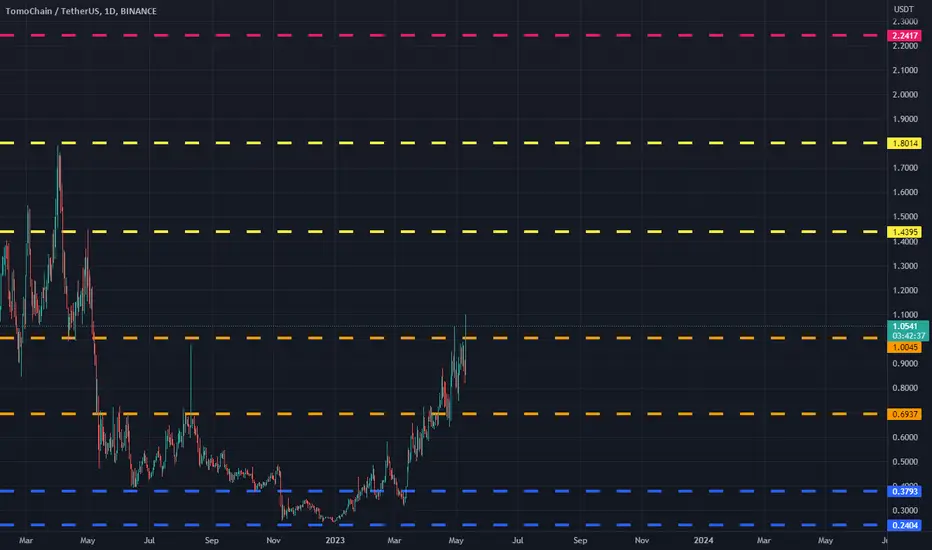
TOMOUSDT(TomoChain) Daily tf Range Updated till 10-05-23TOMOUSDT(TomoChain) Daily timeframe range. price action is not very stable on this one, pushing continuously non the less. closing above #1.0045 will oven a path till #1.4395. pushing on days like this where many alts bleeding is a good prop.
TOMO: Defying GravityStarting off with the basics, TOMO/USDT has seen a hefty 22% uptick in the past 24 hours and is currently trading at 1.0327. However, the Relative Strength Index (RSI) is at 74, which is a bit high, indicating that the asset might be overbought. This means that there could be a potential pullback in price due to traders selling to take profits.
Next up, let's look at our Fibonacci retracement levels. The 0 levels at 0.9800 is acting as a potential resistance since it's just below the current price. Meanwhile, the 0.5 and 1 Fibonacci levels at 0.8994 and 0.8187, respectively, could act as support if the price starts to retrace.
Let's now consider the Bollinger Bands. These levels give us a sense of the volatility in the market and potential support and resistance levels. The price is currently between the middle and the upper band, suggesting it's in a bullish phase. The upper band at 1.0547 is the next immediate resistance, while the middle band at 0.9408 can act as a support. If the price breaks below the middle band, the lower band at 0.8272 comes into play as a stronger support.
The Moving Average Convergence Divergence (MACD) at 0.0360 and the stochastic oscillators at 67 both support the bullish sentiment, indicating a strong buying momentum in the market. This could potentially push the price to test the resistance levels.
Moreover, the positive volume oscillator at 25% and the high On-Balance-Volume (OBV) at 131M indicate that there's significant buying pressure. This is a good sign for the bulls and could possibly drive the price up further.
The Exponential Moving Average (EMA) at 0.9244 is an important level to keep in mind. If the price falls, this could act as a support level.
Finally, the 24-hour high and low levels at 1.1 and 0.8273, respectively serve as the extreme resistance and support levels for the day.
To sum up, the immediate resistance levels are the 0 Fibonacci level (0.9800) and the upper Bollinger Band (1.0547), while the immediate support levels are the middle Bollinger Band (0.9408), the 0.5 Fibonacci level (0.8994), and the EMA (0.9244). If the bullish momentum continues, the 24-hour high (1.1) could be tested. If a pullback occurs, the 24-hour low (0.8273) could be the stronger support to watch for. Always keep an eye on these levels and adjust your trading strategy accordingly.

+17% in Profit; Perfect Work of the IndicatorThe 1000x indicator worked well, resulting in a 17% profit. The bearish cycle will soon be over, so prepare to go long soon.

TOMO ANALYSIS (1D)Hi, dear traders. how are you ? Today we have a viewpoint to SELL/SHORT the TOMO symbol.
For risk management, please don't forget stop loss and capital management
When we reach the first target, save some profit and then change the stop to entry
Comment if you have any questions
Thank You


TOMO USDT NEXT EXPECTED MOVE.#TOMO /USDT Updates!!
• On daily & 4h tf macd & rsi indicators still look bearish.
• Fundamentaly too week project.
• Small bounce expected from 0.70$.
• Don't invest upto 3% under this project if you are going now to trade on it.
• Just Do micro trades.
⚠️ Do trades at your own risk⚠️
Follow for more updates.

TOMOUSDT in front of daily resistanceWhat do we see from here? More growth or a pullback?
Chart wants a pullback after testing resistance again in my opinion.
