Lingrid | TONUSDT bullish BREAKOUT Signals UPWARD MomentumOKX:TONUSDT broke and closed above the downward channel, which was indicative of a correction phase. For the past two weeks, the price has been consolidating between 5.35 and 5.80. Last week, we saw a weekly doji candle, which typically signifies potential momentum in the market in case of breakout. Given that the price has already broke last week’s high, I believe the market will continue to push toward higher levels. If we see a retest of the channel boundary and the price rejects that level, we can anticipate further upward movement. My target is resistance at 6.00
Traders, if you liked this idea or if you have your own opinion about it, write in the comments. I will be glad 👩💻
TONUSDT trade ideas

Farshid.m//@version=2
//Name: Price Action Channel Trading System v0.3 by JustUncleL
//Created By: JustUncleL on 3 Aug 2016
//Version: 0.3
//
study(title="Price Action Trading System v0.3 by JustUncleL",overlay = true, shorttitle="CCIPAT v0.3 by JustUncleL")
//
len = input(14, minval=1, title="CCI Length")
lenUpper = input(75, minval=1, title="CCI UpLevel")
lenLower = input(-75, maxval=-1, title="CCI DownLevel")
bars_on = input(true, title="Color CCI Bars")
src = input(close,title="CCI Source")
lenLo = input(5, minval=2, title="Low Channel Length")
lenHi = input(5, minval=2, title="High Channel Length")
lenMe = input(4, minval=1, title="Median Channel Length")
//
fastLength = input(12, minval=1,title="MACD Fast Length")
slowLength=input(17,minval=1,title="MACD Slow Length")
signalLength=input(8,minval=1,title="MACD Signal Length")
//
rsiLen = input(7,minval=2,title="RSI length")
rsiUpper= input(70,minval=50,maxval=100,title="RSI Upper limit")
rsiLower= input(30,maxval=50,minval=0,title="RSI Lower Limit")
//
filterM = input(true,title="Use MACD confilter filter")
filterR = input(true,title="Use RSI confirm filter")
filterE = input(true,title="Use Trend direction filter")
dCandles= input(4,minval=2,title="Direction test Candles")
//
rsiVal = rsi(src,rsiLen)
//
// Calculate MACD and color background
fastMC = ema(src, fastLength)
slowMC = ema(src, slowLength)
macd = fastMC - slowMC
signal = sma(macd, signalLength)
OutputSignal = signal > macd ? 1 : signal < macd ? -1 : 0
bgcolor(OutputSignal>0?red: OutputSignal<0?green:yellow, transp=90)
plot(slowMC,color=blue,transp=0,title="Slow EMA trend line", linewidth=2)
// Calculate and draw the Price Action channel
emaLo = ema(low,lenLo)
emaHi = ema(high,lenHi)
emaMe = ema(hl2,lenMe)
plot(emaLo,title="Low Price Line",style=line,color=gray,transp=0,linewidth=2)
plot(emaHi,title="High Price Line",style=line,color=gray,transp=0,linewidth=2)
plot(emaMe,title="Median Price Line",style=line,color=orange,transp=0,linewidth=2)
// Calculate CCI
cciVal = cci(src, len)
// Calculate CCI indicating continuance of trend.
isup = cciVal > lenUpper
isdown = cciVal < lenLower
barcolor(bars_on ? isup ? aqua : isdown ? black : na : na )
// Check have alert and use MACD filter
cciup_alert = isup and close>open and (not filterR or rsiVal>rsiUpper) and (not filterM or OutputSignal<0) and
(not filterE or (emaMe>slowMC and rising(slowMC,dCandles))) ? na(cciup_alert ) ? 1 : cciup_alert +1 : 0
ccidn_alert = isdown and close0) and
(not filterE or (emaMe<slowMC and falling(slowMC,dCandles))) ? na(ccidn_alert ) ? 1 : ccidn_alert +1 : 0
//
plotshape(cciup_alert==1? cciup_alert : na, title="CCIPAT Up Arrow", style=shape.triangleup,location=location.belowbar, color=olive, transp=0, size=size.small)
plotshape(ccidn_alert==1? ccidn_alert : na, title="CCIPAT Down Arrow", style=shape.triangledown,location=location.abovebar, color=red, transp=0, size=size.small)
// generate an alert if required.
alertcondition(cciup_alert==1 or ccidn_alert==1, title="CCIPAT Alert", message="CCIPAT Alert")
//EOF

TON 4H possible Short setup - Sep 24 2024#TON has seemingly formed a symmetrical triangle and it seems it's going to make a breakout from below.
The trigger for the Short entry would be a 4H close below the 5.44 level and the targets would be: 5.28 - 5.11 - 4.94 - 4.77
Stoploss would be 5.56. Max lev allowed 3X

TONUSDT Potential Buy OpportunityTONUSDT has formed a double bottom below the crucial 5.00 level and subsequently rebounded, closing above it. However, recent price action shows signs of weakening, as indicated by bearish divergence, which suggests the possibility of a pullback. Historically, the price has been consolidating within the 5.0 to 6.0 range, forming a triangular pattern. This implies that the market could stay confined within this range for a while. The price might pull back toward the key support level, potentially treating the double bottom as a false breakout. The target is the resistance zone around 5.90

Ton coin bullish 3 candlestick patternI think the body of 3 daily candles make some bullish moves to the third fib

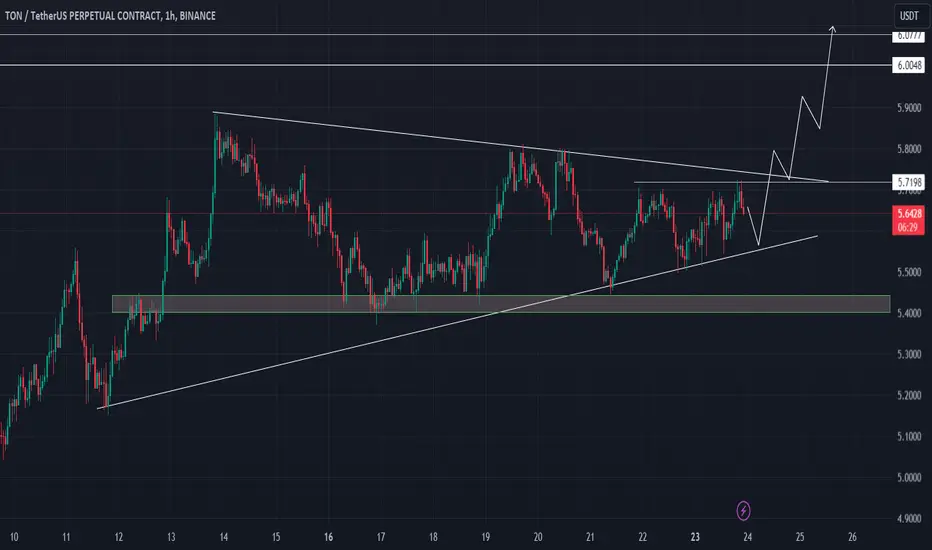
TON USDT IF BRAKE OUT1. Symmetrical Triangle Pattern:
The chart shows a symmetrical triangle pattern, which typically forms as a result of market indecision. The price is converging between two trendlines, indicating that a breakout is imminent.
This type of pattern can break in either direction, but since it’s forming after a prior uptrend, it often signals a continuation to the upside (bullish bias).
2. Potential Breakout:
The upper resistance line of the triangle is critical. A breakout above this resistance could lead to a strong upward move.
The projected breakout target is marked on the chart around 6.0083 USDT. This is about 8.15% from the current price, indicating a good risk/reward ratio for the trade.
3. Key Levels:
Support: The lower white line of the triangle provides immediate support. The Stop Loss (SL) is positioned near 5.3135, below this support, to protect against a downside move.
Resistance: The upper white line is the resistance level. A break above this level would confirm the triangle breakout and could lead to the target of 6.0083.
4. Risk/Reward Setup:
The setup shows a balanced risk/reward ratio. If the price breaks out upwards, the reward is significantly higher than the risk.
The risk is clearly defined by the stop-loss at 5.3135, while the reward is aiming for a higher level near 6.0083 USDT.
5. Momentum Indicator:
At the bottom, the momentum indicator (likely MACD or a histogram) shows some neutral momentum with slight bearish moves recently, which may reflect the consolidation. However, if the price starts to move upwards, the indicator should turn more positive, confirming the bullish breakout.
6. Conclusion:
This symmetrical triangle offers a good potential trade setup. Watch for a breakout above the triangle resistance, which could lead to a continuation towards 6.0083 USDT.
If the price fails to break out and falls below 5.3135, the trade will likely be invalidated, triggering the stop-loss.
DYOR

Toncoin (TON) price analysisToncoin’s (TON) price has seen relative stability in recent price action, holding firmly above the $5.49 support level. However, for true recovery and significant growth, TON needs to flip the $5.96 resistance into support.
Only after crossing this threshold can TON unlock its potential to deliver substantial profits to investors.
Toncoin is on the verge of a major profit breakthrough, potentially bringing billions of dollars into the market. Data from the Global In/Out of the Money (GIOM) indicator reveals that around 773 million TON tokens, worth approximately $4.2 billion, were purchased between the price levels of $5.41 and $5.94. If TON manages to break past the $5.96 mark, the entire supply purchased within this range would turn profitable.
This surge in profitability could lead to increased bullish sentiment, as investors who have been holding Toncoin for an extended period would be incentivized to maintain their positions. This scenario could further drive up demand, pushing Toncoin’s price higher as more investors enter the market to capitalize on potential gains.
Given the current sentiment, Toncoin is expected to continue consolidating between $5.49 and $5.96. This sideways movement will likely delay any breakout above the upper limit, potentially keeping the token in its current range for a while.
However, if bullish momentum overtakes bearish sentiment, Toncoin could breach the $5.96 barrier. This move would trigger profits for holders of the $4 billion worth of TON supply bought between $5.41 and $5.94, thus invalidating the bearish-neutral outlook and setting the stage for further gains.

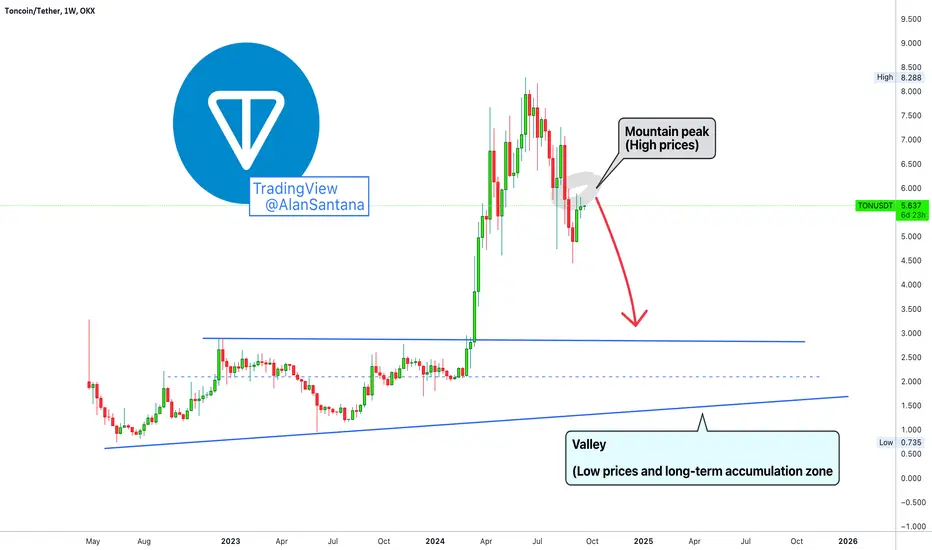
Toncoin vs Litecoin (Comparison)Here we can see how the "mountain peak" is considered a high price and denotes bearish potential. The valley is where the low prices are found and where accumulation happens before a major bullish wave.
Compare this chart and trade-idea with the Litecoin vs Toncoin trade-idea just published ( see here ). The difference is huge.
➖ One pair is trading pretty high, near resistance; Toncoin.
➖ Another pair is trading pretty low, near support; Litecoin.
Now, the market can do whatever it does.
The market can move in whatever way, it is hard to predict or make a guess, but, if you are buying expecting for prices to rise, the wise choice is the one trading low.
When prices are high, either SHORT or wait for the market to move lower before moving in.
This is the big difference to consider now when looking at the charts.
Some are trading at the bottom while others are not.
The bottomed out ones are safe. Even if there is another drop or some more consolidation, it is easy to wait and think long-term. Those high up are not good because we don't know for how long they will correct (how low they can go) nor how much consolidation they will need to move back up. It is better to wait from the outside with capital on hand and get the better prices when there is a major drop.
Popular wisdom goes something like this: Sell high, buy low.
Namaste.
Toncoin/USDT: Bearish Breakdown Threatening Key Support Levelhello guys.
I said my perspective about ton before:
let's go through the lower level:
The price of Toncoin (TON) is facing resistance from a descending wedge pattern, with multiple rejections from the upper boundary.
Price has not engulfed the previous highs, indicating that bulls are losing momentum and a breakout to the upside is less likely for now.
Fibonacci retracement levels are drawn, with the 0.618 level acting as a strong resistance zone.
If the current support (marked with the trendline) breaks, it could confirm a bearish continuation.
The first major target to the downside is the $5.17 level, which aligns with previous support.
A further breakdown could drive the price towards the $5.00 psychological support, a critical zone for bulls to defend.
A breakdown below $5.00 would open the path for deeper bearish targets.
Summary:
Descending wedge pattern with no bullish engulfing.
Price is testing support; a break could lead to a significant downside move.
Key support levels at $5.17 and $5.00.
Bearish continuation if these supports fail.
___________________________
✓✓✓ Always do your research.
❒❒❒ If you have any questions, you can write them in the comments below, and I will answer them.
❤︎ ❤︎ ❤︎And please don't forget to support this idea with your likes and comment

LOOKING FORWARD TO TON RALLYThis piece of content is only a guide to my thought process on what i'm preparing for looking forward into the last quarter of the year.
The Ton Ecosystem has been nothing but rewarding with exciting opportunities from inception.
Key ranges has been marked out, trade analysis has also been marked out.
Do have a lovely weekend guy!
Stay safe
Trader45

TONUSDT Elliott Waves Analysis (LONGTERM)Hello friends.
Please support my work by clicking the LIKE button👍(If you liked). Also i will appreciate for ur activity.
Everything on the chart.
Entry: market and lower
Targets: 10 - 15 - 20
Investment target zone: 20 - 25
after first target reached move ur stop to breakeven
Stop: (depending of ur risk).
ALWAYS follow ur RM
risk is justified
It's not financial advice.
DYOR!

TONUSDT BUY ANALYSIS Buy Tonusdt at 5.375 level and set a target profit at 6.429 for Tp1 and 7.587 for Tp2 , Set stoploss to 4.379 . Use money management

TONUSDT Price Prediction (Update) - Time 1dAlways and at all times. All events will occur in the chart.
Trend Prediction - TON/USDT Forecasting - Resistance and Support Lines
**** Yousef Sharafi ****
Follow me here for more analysis

Lingrid | TONUSDT Price ACTION Before the anticipated ALTSEASONThe price perfectly fulfilled my last idea. OKX:TONUSDT has bounced off the support level and is now trading just below the key round number of 6.00. Currently, the market is in an accumulation phase, and a breakthrough of this critical level could trigger a bullish run. This hints that the market may be gearing up for the upcoming altseason. Presently, the price action is forming a compression channel in the shape of an ascending triangle. The upward trendline below has supported the price for about a week, and if the price retests both the support and the trendline, I anticipate a bounce and a continuation of the upward momentum. My target is resistance zone at 6.180
Traders, if you liked this idea or if you have your own opinion about it, write in the comments. I will be glad 👩💻

TONUSDT - UniverseMetta - Analysis#TONUSDT - UniverseMetta - Analysis
Formation of a 3-wave structure from the lower boundary of the correction movement, since the movement is lateral, one can expect a move to the upper boundary. In the opposite scenario, for further decline, it is necessary to exit the sideways movement. Since rebounds from the boundary are within 50%, one can see an excellent risk/profit ratio of 1:5 and 1:7.
Target: 6.161 - 8.190

Toncoin (TON) price analysisToncoin (TON) is struggling to push above the resistance at $5.60, with buyers facing intense selling pressure. TON got rejected from the $6 level on Friday as buyers lost steam at upper levels after demand dried up. As a result, TON settled at $5.81, an increase of 5.81%. However, as selling pressure intensified, TON fell over the weekend, dropping by 2.38% on Saturday and 2.24% on Sunday to settle at $5.55. The current week began with sellers continuing to exert control as TON fell to a day low of $5.39 before recovering and settling at $5.47.
TON attempted a move past $5.60 on Tuesday as it rose to a high of $5.59. However, it could not do so and eventually settled at $5.50 after an increase of 0.56%. The current session sees TON marginally down as buyers and sellers look to establish control and dictate the price. A push above $5.60 could result in another move towards $6. However, if sellers continue to exert control, TON could drop to $5.30, where the 20-day SMA is currently positioned, or even lower to its $5 support level.

TON currency analysis Your currency is in a neutral trendTON currency has been in an upward trend since its arrival.
But after reaching the ceiling of this upward trend, we see the price return to the floor for this currency.
At the moment, you can see your currency in a neutral trend in the 4-hour period, and two important ranges of the ceiling and floor have been identified in this analysis, until the price breaks these two ranges, nothing special will happen to this currency.

TON → is in a dangerhello guys.
Head and Shoulders Pattern: A classic bearish reversal pattern has formed with a left shoulder, head, and right shoulder, indicating potential downside.
Neckline Break: The price has broken below the neckline around $5.30, confirming the pattern and suggesting further bearish momentum.
Target Projection: The measured move target from the head to the neckline projects a potential drop towards $3.27.
Resistance Levels:
Immediate resistance at $5.30 (previous neckline).
Further resistance near $6.10 (potential pullback area).
Support Levels:
Immediate support around $4.60.
Major support at $3.27 (pattern target).
Outlook: Bearish, with a high probability of a decline towards the $3.27 level unless the price reclaims the neckline. Watch for any signs of reversal or a break above $5.30 to invalidate the bearish scenario.
___________________________
✓✓✓ Always do your research.
❒❒❒ If you have any questions, you can write them in the comments below, and I will answer them.
❤︎ ❤︎ ❤︎And please don't forget to support this idea with your likes and comment

Toncoin shows both bullish and bearish signs. So, what’s next?Toncoin (TON) has been making headlines lately, with a significant drop from its recent highs of around $8 down to now $5.51 at press time.
Toncoin’s net network growth stood out at press time, showing a 9.03% increase. This bullish signal indicated a steady inflow of new users into the network, reflecting growing interest.
However, without significant buying pressure, this growth alone might not be enough to reverse the downward trend.
From a technical analysis perspective, the relative strength index (RSI) was at 41.82, nearing oversold territory. Thus, Toncoin could be due for a short-term bounce, although it does not confirm a sustained reversal.
The Bollinger Bands (BB) showed that Toncoin was consolidating, with the price nearing the lower band at $5.43. The lower band could indicate support, with volatility likely to increase.
The upper band was at $5.60, and a breach of this level could signal upward momentum.
Toncoin’s indicators provided a mixed outlook. While Network Growth and whale accumulation were positive, the decline in large transactions and a neutral “In the Money” showed caution.
Combined with technical signals like RSI and Bollinger Bands, Toncoin looked to be at a key point.
The market’s next move could be influenced by rising volume and a potential breakout from the current consolidation phase.

Toncoin (TON) price analysisToncoin (TON) registered an incredible increase of almost 14% over the past seven days, despite its upward push stalling over the weekend after encountering strong resistance around $6. TON was extremely bullish last week as it surged on Monday, reaching a day high of $5.69. However, buyers could not sustain momentum, and TON eventually settled at $5.25, registering an increase of 6.12%. TON surged past the 20-day SMA on Tuesday, rising by 5.65% and settling at $5.55. However, after encountering resistance, the price fell back on Wednesday, dropping to a low of $5.15 before recovering and settling at $5.39, back above the moving average.
TON attempted a move past the resistance at $5.60 on Thursday but eventually settled at $5.58 after an increase of 3.43%. It finally broke past this level on Friday, rising by 4.25% and settling at $5.81. Buyers attempted a move to $6 but lost momentum after reaching a high of $5.93, with the 50-day SMA coming into play as resistance. TON fell back over the weekend as demand dried up, dropping 2.38% on Saturday and 2.24% on Sunday to slip back below $5.60 and settle at $5.55. The current session sees TON up by 0.80% after sellers failed to lower the price. Buyers will look to reclaim $5.60. If TON can consolidate above this level, a push above the 50-day SMA to $6 could be possible.
However, if sellers retake control, TON could slip to $5.30, where the 20-day SMA could act as support. Should TON continue to drop, its next support level lies at $5.

Short idea on $TONAfter analyzing the TON/USDT chart, it is clear that a higher-degree correction is currently underway, with potential to reach $3. I am incorporating a 1 to 2 ratio into the chart (not ideal), but I will allocate a small balance to this idea

TONUSDT wave 4 in progressTonusdt has completed wave 3 and has begun a correction for wave 4, which is expected to end around the 4.7 - 3.7 area as indicated on the chart. This level presents a strong buy-back opportunity, targeting the final wave 5 leg.
Share your thoughts on this analysis with us.
