Lingrid | TONUSDT Buying OPPORTUNITY in the ACCUMULATION Zone OKX:TONUSDT saw a sharp sell-off from the double top near 3.59, but the price rebounded from the 2.88 support zone, forming a potential accumulation structure. The current setup suggests a consolidation just below the key resistance at 3.25, aligning with the descending trendline. A breakout above
Trading activity
Transactions
Volume
Traders

TON/USDT on Fire: Bullish Momentum Builds Toward Major Targets!By examining the #TONCOIN chart on the 3-day timeframe, we can see that after correcting down to $3, the price has started pumping again and is showing strong bullish momentum. So far, it has gained over 15%, and I expect this uptrend to continue! The next targets are $3.64, $4.20, and $4.66. The ex

Toncoin (TON): One Good Long Position Can Be Taken HereToncoin has a good chance of a breakout happening soon, where we are seeing a good 7:1 RR trade that can be taken on bigger timeframes. Toncoin is one of the coins that we think has yet to reveal its potential ATH....
More in-depth info is in the video—enjoy!
Swallow Academy

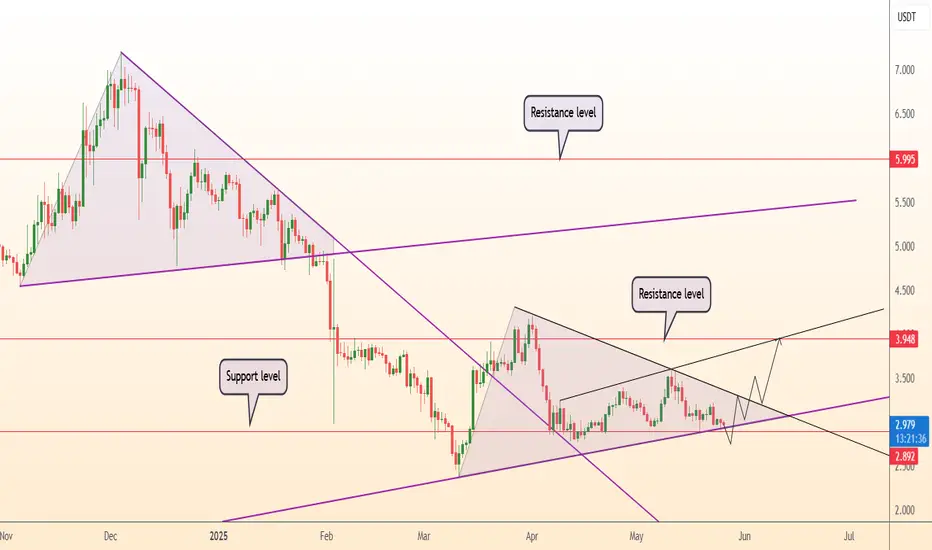
DeGRAM | TONUSD forming the new triangle📊 Technical Analysis
● Price exited a 6-month falling wedge, retested the purple breakout line near $2.90 and is printing successive higher lows inside a nascent up-sloping channel.
● The wedge’s 0.618 projection and horizontal cap align at the $3.95 resistance band; holding above the $2.89 suppor
TON PERPETUAL TRADE ,Sold From $3.44TON PERPETUAL TRADE
TON SELL SETUP
Currently $3.44
Sold From $3.44
(Trading plan If TON go up to $3.60
will add more shorts)
Expecting target $3.33 OR DOWN
In the event of an early exit,
this analysis will be updated.
Its not a Financial advice

Be careful with TON !!!Currently, TON is forming an ascending triangle, indicating a potential price increase. It is anticipated that the price could rise, aligning with the projected price movement (AB=CD).
However, it is crucial to wait for the triangle to break before taking any action.
Give me some energy !!
✨We s

Toncoin 5X Lev. Full PREMIUM Trade-Numbers (PP: 1480%)This chart setup with leverage originally came to my attention around 15-April. Seeing the same market conditions now after some consolidation and a small higher low makes the setup stronger.
This is an easy one. I think it has a good chance of success and the timing is about right.
Just make sure

TON | Long | Telegram-Backed Growth | (May 28, 2025)TON | Long | Telegram-Backed Growth + Open Interest Surge | (May 28, 2025)
1️⃣ Quick Recap: TON (The Open Network) is showing strong momentum following a major +20% price surge. With Telegram’s legacy, growing utility, and rising interest across spot and futures markets, this setup looks promising

$TON Breakout Loading CRYPTO:TONUSD is at the apex of a symmetrical triangle, a breakout is imminent.
A daily close above $3.3095 could trigger a strong move toward $4.2128, $5.6017, and $7.2199 (+120%).
Watch closely. High risk-to-reward setup loading.
DYRO, NFA

Toncoin (TON): Seeing Buyside Dominance | Shooting UpToncoin had good upward movement where the price reached our high area (which was the first target of ours). We see that we have established a strong bounce area near the local support zone so at any point from here, we are expecting to see volatile movement to upper zones!
Swallow Academy

See all ideas
Summarizing what the indicators are suggesting.
Oscillators
Neutral
SellBuy
Strong sellStrong buy
Strong sellSellNeutralBuyStrong buy
Oscillators
Neutral
SellBuy
Strong sellStrong buy
Strong sellSellNeutralBuyStrong buy
Summary
Neutral
SellBuy
Strong sellStrong buy
Strong sellSellNeutralBuyStrong buy
Summary
Neutral
SellBuy
Strong sellStrong buy
Strong sellSellNeutralBuyStrong buy
Summary
Neutral
SellBuy
Strong sellStrong buy
Strong sellSellNeutralBuyStrong buy
Moving Averages
Neutral
SellBuy
Strong sellStrong buy
Strong sellSellNeutralBuyStrong buy
Moving Averages
Neutral
SellBuy
Strong sellStrong buy
Strong sellSellNeutralBuyStrong buy