TradeCityPro | TON: Eyes Breakout from Daily Range Top👋 Welcome to TradeCity Pro!
In this analysis, I’m going to review the coin TON for you. The TON project is developed for Telegram and operates on a Layer One blockchain, enjoying significant popularity within the Telegram community.
✔️ The coin currently has a market cap of 7.95 billion dollars and
Trading activity
Transactions
Volume
Traders

TON It will grow soon...Currently, TON is forming an ascending triangle, indicating a potential price increase. It is anticipated that the price could rise, aligning with the projected price movement (AB=CD).
However, it is crucial to wait for the triangle to break before taking any action.
Give me some energy !!
✨We

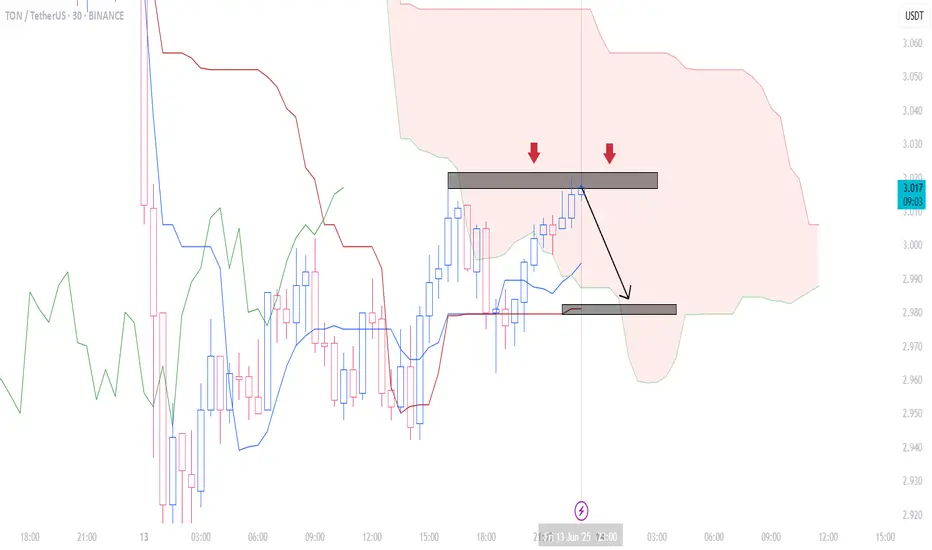
ton easy tradeThis is my first time using Ichimoku. Based on the levels created, I think the specified level will be touched soon. Let's sit back and watch.
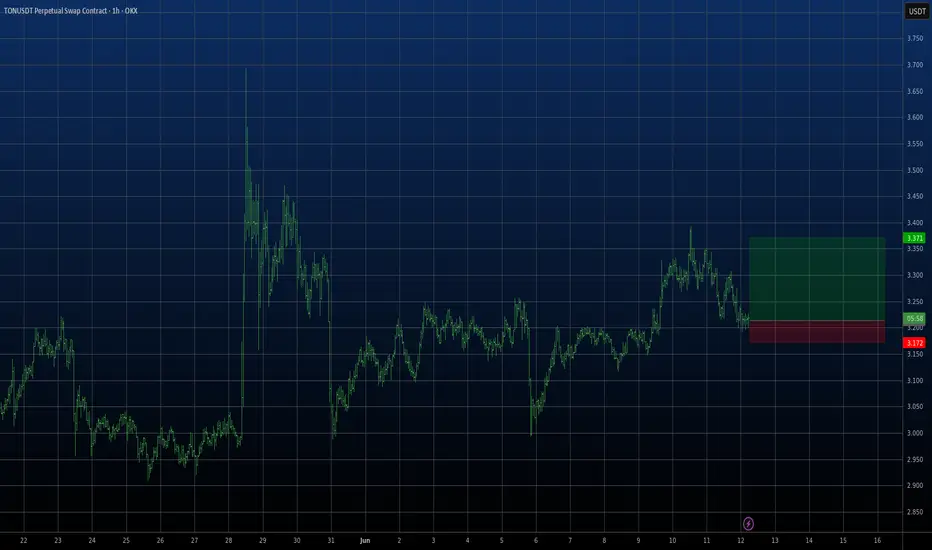
TONUSDT On the @TONUSDT chart, price is currently making a corrective move after reacting to the key support at 2.800. It may rise toward the 3.230 resistance and potentially break higher with a pullback to continue upward. However, if the 2.800 support fails, a deeper drop could follow. ⚠️📉
Resistances:

$TON is one of the best spot Bags for this cycleGROK AI & Telegram deal signing soon ... !
Alt season will bring it to 9$ !
We may see even as high as 13$ but i wont count on it

Good moment for Buy TONGood moment for Buy TON. We have small local down trend channel, but also it is low level of current "big" up trend channel. And this point can be used for good entry with good risk reward ration. Stop below of local down channel. Will see...
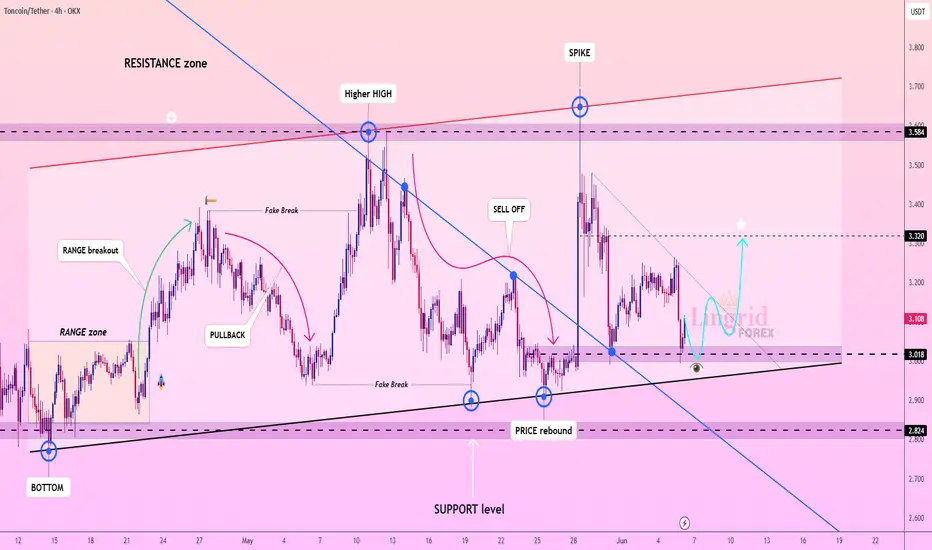
Lingrid | TONUSDT Consolidating Within Defined Trading RangeOKX:TONUSDT is attempting a rebound from key support near 3.00$ after a sharp sell-off from the upper resistance area. The chart shows a higher low structure forming just above trendline support, hinting at a bullish reversal setup. If price holds this zone, a breakout through the descending trendl
Toncoin (TON): Good Opportunity For Long Position | Good R:RToncoin is still looking good for upward movement, despite it moving rather sideways since the last time we checked the coin.
More in-depth info is in the video—enjoy!
Swallow Academy

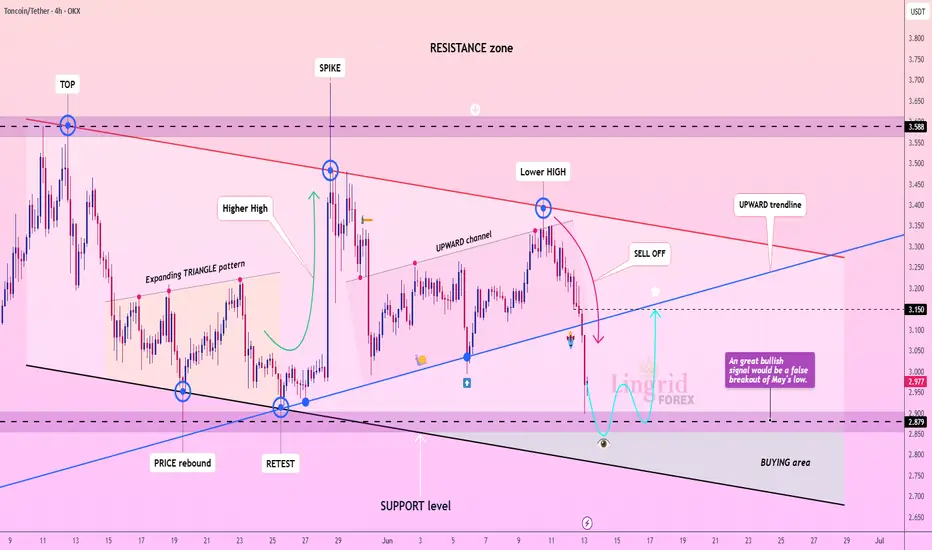
Lingrid | TONUSDT monthly Low Bounce OpportunityOKX:TONUSDT is undergoing a significant correction after forming a lower high near the 3.40 level, right under the red resistance trendline. The price has now broken below the upward channel, accelerating the sell-off toward the key support at 2.87. A false breakout below May’s low could act as a b
Phemex Analysis #89: Toncoin (TON) - Breakout or Breakdown?!Toncoin ( PHEMEX:TONUSDT.P ) has seen its price pull back to $3.22, marking a 60% decline from its all‑time high near $8.28 in June 2024. While this might raise concerns, the project’s fundamentals have been strengthening dramatically, validating long‑term optimism. Over the past month, TON has re

See all ideas
Summarizing what the indicators are suggesting.
Oscillators
Neutral
SellBuy
Strong sellStrong buy
Strong sellSellNeutralBuyStrong buy
Oscillators
Neutral
SellBuy
Strong sellStrong buy
Strong sellSellNeutralBuyStrong buy
Summary
Neutral
SellBuy
Strong sellStrong buy
Strong sellSellNeutralBuyStrong buy
Summary
Neutral
SellBuy
Strong sellStrong buy
Strong sellSellNeutralBuyStrong buy
Summary
Neutral
SellBuy
Strong sellStrong buy
Strong sellSellNeutralBuyStrong buy
Moving Averages
Neutral
SellBuy
Strong sellStrong buy
Strong sellSellNeutralBuyStrong buy
Moving Averages
Neutral
SellBuy
Strong sellStrong buy
Strong sellSellNeutralBuyStrong buy