4HR TONseems there may be a hidden bear div on the 4hr ton, still waiting for a red dot on momentum , but so far, vwap doesn't look healthy and money flow decreasing. Also have a bearish purple dot on Yalahari B. Can we get a red dot print because the lower time frame shows bear div? if this does play then i expect to hit bot fib targets and i will also target the vector zone within the fib.
TONUSDT_EQAXYO trade ideas

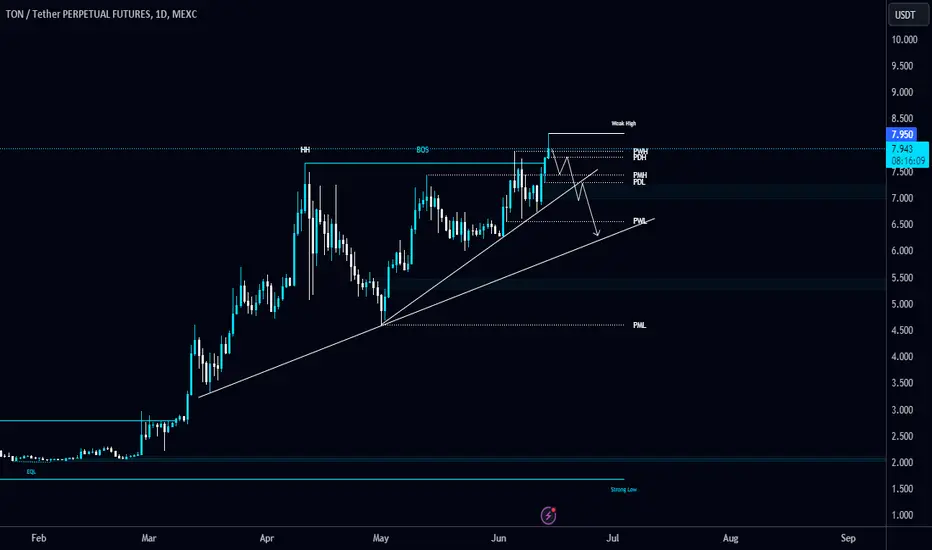
#TONCOIN/USDT is heading towards the Diagonal Trendline retest i#TONCOIN/USDT is heading towards the Diagonal Trendline retest in Daily TF!
$TONCOIN needs to hold this trendline to remain bullish. I'm expecting $6.5 region soon. Wait for a successful retest to open a long position.


Daily Trading Plan for BTC SOL NEAR TONPlease view my daily trading plan for BTC SOL NEAR TON and please leave a comments if you ll have any questions

#TONUSDT ( BREAK UP ?? )Let us pay attention to him,
apparently he wants to break the roof of the small green pattern.
In case of successful failure,
each of the higher red lines is the target of the next step

TON"We expect a strong surge for this currency, especially since it is backed by the Telegram platform, and we anticipate it will surpass the $10 mark soon."

TON → The bulls are almost ready. Breakout 7.23, rally ...OKX:TONUSDT is starting to show bullish potential. This is quite interesting for us, because, in general, the coin's potential is huge. BTC momentum could push the coin to rally.
The bulls have held the defense above 5.985, forming an intermediate bottom. In the current range, the 6.45 - 6.65 area, where the maximum number of coins have been traded (bought), is a zone of interest for the big player and he will try to defend it. The range of market accumulation is 7.23 - 6.23. Until the price leaves this range, the market will be flat.
It is worth paying attention to the local descending resistance. There is an attempt to break through it and the price may strengthen to 7.23. The whole emphasis is on this area. A correction or pre-breakout consolidation may form before the breakout.
Resistance levels: 7.23, 7.67
Support levels: 6.7, 6.23
I am waiting for the retest of 7.23. It is interesting to see the reaction from which it will be possible to form further strategy (pullback or breakout). The probability of a breakout is increasing on the background of a strong bitcoin.
Regards R. Linda!

TON elliott wave to ATH 1hr chartTON is setting up nicely for a 1-5 elliott wave to ATH. Looking for higher low green trigger dot for entry.

I Cannot Short This !!! situation+next targets.Hi.
KUCOIN:TONUSDT
TON is in an ascending triangle which means the price is about to do a good bullish movement. The price can increase as much as the measured price movement ( AB=CD ) .
✨ Traders, if you liked this idea or have your opinion on it, write in the comments, We will be glad.
_ _ _ _ __ _ _ _ _ _ _ _ _ _ _ _ _ _ _ _ _ _ _ _ _ _ _ _ _ _ _ _
✅Thank you, and for more ideas, hit ❤️Like❤️ and 🌟Follow🌟!
⚠️Things can change...
The markets are always changing and even with all these signals, the market changes tend to be strong and fast!!

Correct down to the support rangeTON could correct down to the support range of $7 and then resume its upward movement. As long as it remains above the ascending trendline, there is potential for growth towards the targets of $8.5 and $9.

TONCOIN LONG BUYStrong upside potential on the TONCOIN crypto messaging network telegram pass into the top 10 crypto.
Big potential of rise thanks to that blochain and to its use by fe numerous users telegram one could note that the TONCOIN and to remain rather strong compared to the fall of the crypto classer in the top this last days


Comprehensive Analysis of TON Ecosystem🔍 Today, we will conduct a thorough and comprehensive analysis, focusing specifically on the TON network ecosystem.
Bitcoin Analysis
📈 After reaching the support level at 66036, Bitcoin experienced a fake breakout. Following this, several supportive candles formed, and currently, the price is moving slightly away from the support level with increasing buying volume.
📊 With a breakout above 44.18 in the RSI, we can get a confirmation from the RSI indicator. After this, we should wait for price confirmation as well.
🕒 The riskiest entry point for a long position could be the short-term resistance at 66363. However, since today is Sunday and the market is closed, I prefer not to open a position at this resistance. Instead, I will wait for the price to reach 67110 and observe its reaction to this level.
🚀 If it breaks this level, I will open a position. The next trigger for a long position would be at 70108. Once the price reaches 71500, it will enter a strong supply zone, and I prefer to wait for a breakout above this zone.
📉 For a short position, I will consider it after breaking 66036, depending on Bitcoin's dominance trend. I believe Bitcoin will range until tomorrow, which will allow the new week to start and the SMA25 to catch up with the candles, potentially bringing momentum back into the market.
TON Ecosystem Analysis
🌐 First, let’s discuss the fascinating ecosystem of the TON blockchain to understand its role in the crypto space. The initial section involves airdrops and shitcoins, starting with the NOTCOIN project, which operated as a tap-to-earn mechanism, rewarding users with NOT tokens for every click. This project gained substantial user traction and was listed on Binance.
👥 Following NOTCOIN, other projects like tapswap, Blum, and Hamster Combat emerged. Notably, Hamster Combat has over 100 million active users and 37 million Telegram subscribers. This significant user base suggests that airdropping this token could onboard over 100 million users onto the TON blockchain, greatly contributing to network growth.
📈 Given the popularity of these projects on social media, this number could potentially reach 200 million or more. This is one of the primary reasons why the TON blockchain can thrive, which could subsequently drive the TON coin's price upward.
💧 The next section is the DeFi space on the TON blockchain. According to a recent announcement from the TON team, liquidity providers can now farm TON tokens by creating LP tokens on the TON blockchain, which is excellent news.
🌱 As illustrated, the stonfi project, a platform for creating LP tokens on the TON blockchain, offers exceptionally high APRs, like 700% and 565%, which can attract many users.
📈 The rest of the TON ecosystem is also detailed in the image provided, which includes more projects. In addition to the ones mentioned above, I have included projects like Tonup, Storm, DAO Lama, and Fragment. These are among the most reputable Telegram projects, each contributing to the blockchain’s growth.
🚀 For instance, Tonup is a launchpad project where you can find and invest in projects during their presale phases, potentially yielding significant profits if the projects succeed. However, it is crucial to research thoroughly before investing, as this can be quite risky and may involve scams.
🏦 Storm is a DEX that allows you to open futures positions in a decentralized manner, similar to Ethereum projects like dydx and gns but specifically on the TON blockchain. DAO Lama is a platform for buying and selling NFTs, staking them for rewards, or using them as collateral to borrow TON coins.
📲 Lastly, Fragment is an exceptional platform where you can perform various tasks within Telegram, such as purchasing usernames, special Telegram numbers, premium subscriptions with TON coins, and advertising in different channels, all powered by blockchain.
TON Chart Analysis
📈 Now, let’s examine the chart to identify potential entry points for this exciting project. The resistance at 7.339 has been broken, and the price is at its ATH, making it impossible to draw resistance levels based on historical data.
📊 However, using the weekly wave Fibonacci extension, as indicated in previous analyses, the price has reached the 1.618 level, rested for a while, and is now moving upwards, breaking the 1.618 level along with the 7.339 resistance. The high volume of bullish candles confirms the uptrend.
🎯 The nearest target for TON is the 2 Fibonacci level, approximately around $10. Given the project hype, as elaborated earlier, it could easily reach this target and potentially go higher.
🔍 In the RSI indicator, we have a critical resistance overlapping with the overbought level (70). Breaking this area could lead to a significant price pump. For trading TON futures, we should switch to the 4-hour timeframe for more detailed insights.
📉 In this timeframe, there was a significant resistance at 7.765, and the price is currently pulling back to it. However, the pullback isn't complete yet, and we can only confirm the pullback after breaking 8.186.
📈 If it does, the parabolic trendline on the chart will be reliable, potentially leading to a parabolic upward move. The futures targets are 9.2 and $10. The RSI trigger at the 70 resistance could also bring momentum into the market upon breaking.
🚫 For a short position, it is advisable not to open one on TON due to its strong upward trend. There are better coins for shorting that are in a downtrend. Nonetheless, the short trigger is at 6.793, but I personally wouldn’t open a short position on TON.
📉 For spot buying, it’s recommended to wait for a pullback and enter during the correction, or move to lower timeframes for entry, though this increases risk. It’s advisable to wait for a confirmation candle if no pullback occurs.
🛑 In case the price reverses downward, having a stop loss is crucial to limit losses. Breaking 6.208 could signal the end of the bullish momentum.
🧠💼 Always remember the inherent risks in futures trading, with the potential for margin calls if risk management is neglected. Stick to strict capital management principles and use stop-loss orders, ensuring an initial target with a risk-to-reward ratio of 2.
🫶 If you found this analysis helpful and want to support me, please boost this analysis. Feel free to leave a comment or suggest a coin you'd like me to analyze next.

TON's Situation: What Shall we Expect ??Hi.
COINEX:TONUSDT
TON is in an ascending triangle which means the price is about to do a good bullish movement. The price can increase as much as the measured price movement ( AB=CD ) .The break out needed for increasing further has not happened but it should happen pretty soon.
✅ Due to the Ascending structure of the chart...
🟢 TON has been Bullish Recently!
🟢 The odds of another Bullish Movement is High!
🟢 Ascending Triangle is Visible on The chart!
🟢 No break out yet!
❗ Note that if the Triangle is broken down with the power of descending candles, our analysis will fail.
Stay awesome my friends.
_ _ _ _ _ _ _ _ _ _ _ _ _ _ _ _ _ _ _ _ _ _ _ _ _ _ _ _ _ _ _ _ _
✅Thank you, and for more ideas, hit ❤️Like❤️ and 🌟Follow🌟!
⚠️Things can change...
The markets are always changing and even with all these signals, the market changes tend to be strong and fast!!


TON Ready for 8.5- 9 $ Dear Traders,
Price playing (ascending Channel)
it seems Ton Coin hold 6.5-7 $ , and next target will be 8.5-9 $
Dont Forget Like& comment please !
Regards,
Alireza!

TELEGRAM #TON to $7Inverse head & shoulders
1st cycle coin
Log targets should be met
Note the neckline has been approximated because of the price action
but I think it is good enough for what we need from this chart.

#TON/USDT breaks the previous high in Daily TF!#TON/USDT breaks the previous high in Daily TF!
I'm expecting a retest of the Diagonal Trendline soon. CRYPTOCAP:TON local support level is $7.44.
TON golden pocket entry with buy blockTON price discovery fib trade. Coming down to golden pocket where there is a buy block. Take profit at fib levels.

TON PriceWith a strong volume surge over 180%, TON crypto will likely ascend this bull run toward the $10 mark in the next few sessions.

TON flag patternTON / USDT
Strong fundamentally coin
The chart is so simple
We can see a Flag pattern printed on HTF
If this pattern can hold in next days we can expect huge bullish wave …

TONUSD 1DTON ~ 1D
#TON So far, this coin has been able to survive the market crash.
We estimate that new ATH will continue to form.
It seems that this will be a very good coin for long-term investment until the end of this year.

TON: Approaching ResistanceTrade setup : This asset has shown relative strength - while markets pulled back, it's marched higher. It's now pushing up against that $7.70 resistance for 3rd time in 3 months. It's formed an Ascending Triangle, with each rejection and pullback shallower than before, the dips are smaller and smaller...buyers are eager to accumulate. BTW, we also issued a bullish fundamental research report ("Coin Pick") on TON recently (May 24) that suggests there's 80% upside based on comparable valuation of other L-1 and L-2 networks. If price breaks above $7.80, it could swing to $10 for +25% gain. Stop Loss (SL) at $6.70, just below prior swing low. If it gets rejected again and pulls back near $6.00 support, we would be buyers for another swing trade entry in Uptrend with +30% upside potential back to $7.70.
Pattern : Price is Approaching Resistance , which is a level where it could pause or reverse its recent advance, at least temporarily. Resistance is often a level where price got rejected in the past, or potentially prior Support level that was broken. (concept known as polarity). Once price breaks above resistance, it can advance higher to the next resistance level. Learn to trade key levels in Lesson 7.
Trend : Short-term trend is Strong Up, Medium-term trend is Strong Up and Long-term trend is Strong Up.
Momentum : Price is neither overbought nor oversold currently, based on RSI-14 levels (RSI > 30 and RSI < 70).
Support and Resistance : Nearest Support Zone is $6.00, then $5.50. Nearest Resistance Zone is $7.70, then $10.00.
