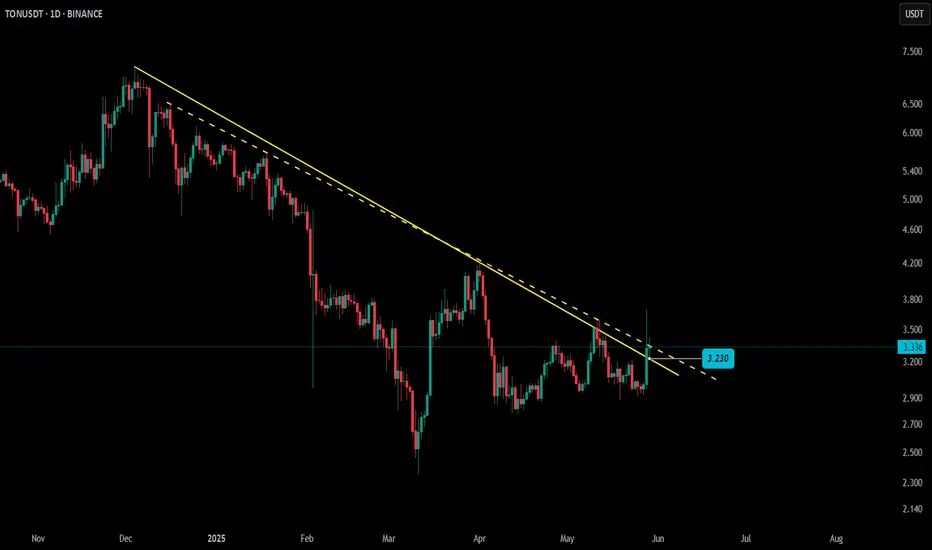
TON – Symmetrical Triangle + Trendline Retest
📈 TON has broken above the descending trendline and is now retesting that breakout zone — a key moment for confirmation.
🔺 Simultaneously forming a symmetrical triangle, indicating compression before a potential expansion.
⚡️ An upside breakout in both structures signals bullish continuation.
✅ A solid hold here could fuel the next strong leg upward.
👁️ Keep a close eye — the setup is tightening, and volatility may soon erupt.
TONUST trade ideas
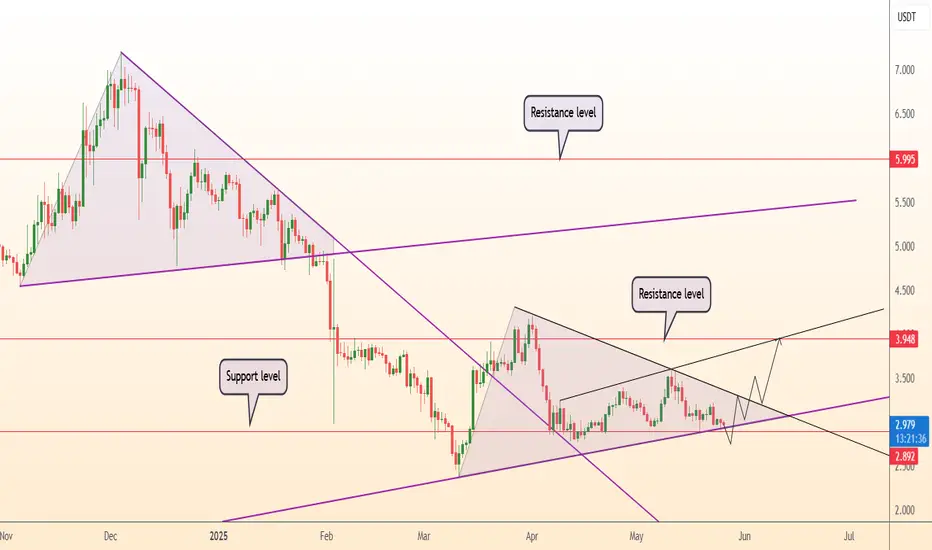
Be careful with TON !!!Currently, TON is forming an ascending triangle, indicating a potential price increase. It is anticipated that the price could rise, aligning with the projected price movement (AB=CD).
However, it is crucial to wait for the triangle to break before taking any action.
Give me some energy !!
✨We spend hours finding potential opportunities and writing useful ideas, we would be happy if you support us.
Best regards CobraVanguard.💚
_ _ _ _ __ _ _ _ _ _ _ _ _ _ _ _ _ _ _ _ _ _ _ _ _ _ _ _ _ _ _ _
✅Thank you, and for more ideas, hit ❤️Like❤️ and 🌟Follow🌟!
⚠️Things can change...
The markets are always changing and even with all these signals, the market changes tend to be strong and fast!!

TONUSDT Forming Falling Wedge TONUSDT is currently forming a classic falling wedge pattern—a historically bullish setup that often precedes major price breakouts. The recent breakout from the wedge accompanied by a significant surge in volume indicates a shift in market sentiment. This pattern suggests the end of a downtrend and the beginning of a new bullish wave. Such formations often result in strong upward price action once the resistance trendline is broken with volume confirmation.
Market participants have shown renewed interest in TON, with price currently stabilizing above a previous key resistance level, now potentially acting as support. This shift aligns with the historical behavior of wedge breakouts, where the asset consolidates briefly before continuing its climb. The current structure and momentum signal a potential 90% to 100% price appreciation, especially as investors recognize the strength of the breakout and the fundamental developments behind the project.
The volume profile further supports this bullish thesis. An increase in buying pressure at the breakout level reinforces the conviction that a trend reversal is in play. If TON maintains its bullish structure, the next major resistance zones could be tested, offering traders and long-term holders a strong opportunity to capitalize on this technical shift.
With rising investor interest and a textbook bullish pattern breakout, TONUSDT is a crypto pair to watch closely. The breakout from the falling wedge combined with solid volume growth and increasing sentiment across crypto communities signals that a new uptrend could be underway.
✅ Show your support by hitting the like button and
✅ Leaving a comment below! (What is You opinion about this Coin)
Your feedback and engagement keep me inspired to share more insightful market analysis with you!

$TON Breakout Loading CRYPTO:TONUSD is at the apex of a symmetrical triangle, a breakout is imminent.
A daily close above $3.3095 could trigger a strong move toward $4.2128, $5.6017, and $7.2199 (+120%).
Watch closely. High risk-to-reward setup loading.
DYRO, NFA

#TON/USDT#TON
The price is moving within a descending channel on the 1-hour frame, adhering well to it, and is heading for a strong breakout and retest.
We are experiencing a rebound from the lower boundary of the descending channel, which is support at 3.20.
We are experiencing a downtrend on the RSI indicator, which is about to break and retest, supporting the upward trend.
We are looking for stability above the 100 Moving Average.
Entry price: 3.30
First target: 3.41
Second target: 3.53
Third target: 3.69

TON PERPETUAL TRADE ,Sold From $3.44TON PERPETUAL TRADE
TON SELL SETUP
Currently $3.44
Sold From $3.44
(Trading plan If TON go up to $3.60
will add more shorts)
Expecting target $3.33 OR DOWN
In the event of an early exit,
this analysis will be updated.
Its not a Financial advice

TON | Long | Telegram-Backed Growth | (May 28, 2025)TON | Long | Telegram-Backed Growth + Open Interest Surge | (May 28, 2025)
1️⃣ Quick Recap: TON (The Open Network) is showing strong momentum following a major +20% price surge. With Telegram’s legacy, growing utility, and rising interest across spot and futures markets, this setup looks promising for continued upside. 🚀
2️⃣ Trade Parameters:
Bias: Long
Entry Zone: $3.21
Stop Loss: $2.71
TP1: $3.66
TP2: $4.98
TP3: $6.00
TP4: $6.83
Partial Exits: Scaling out at each level based on momentum
3️⃣ Key Notes:
✅ What Makes TON Unique:
– Originally built by Telegram and now maintained by the open-source TON Foundation
– Aims to bring blockchain tech to the masses via Telegram integration
– Focus on scalability, performance, and user-friendliness
✅ Recent surge followed news of the Telegram founder regaining travel freedom, potentially fueling future expansions
✅ Corporate partnerships (e.g., Athena Labs) support its growing ecosystem
✅ Competitive with names like Solana and Polygon (MATIC)
✅ Strong order flow data:
– +5M in open interest
– +2M spot buying
– +7M in total order flow
✅ Shorts liquidated, which could create room for a reversal and continued move higher
❌ Invalidation if price closes below $2.71 — structure would be compromised, and reassessment needed
4️⃣ Follow-Up: Watching closely for how price behaves around $3.66. If momentum continues, will manage trade accordingly and provide an update as we approach higher targets.
Please LIKE 👍, FOLLOW ✅, SHARE 🙌 and COMMENT ✍ if you enjoy this idea! Also share your ideas and charts in the comments section below! This is best way to keep it relevant, support us, keep the content here free and allow the idea to reach as many people as possible.
Disclaimer: This is not a financial advise. Always conduct your own research. This content may include enhancements made using AI.

TONCOINCRYPTOCAP:TON In the 4-hour timeframe, key support and resistance zones have been identified based on significant highs and lows. The primary resistance area is at $4.070, while the main support level is at $2.860. A descending trendline has been drawn, and the price trading below the 200-period moving average suggests continued bearish momentum in this time horizon. However, if the near-term resistance at $3.590 is broken, a potential upward movement towards the primary resistance at $4.070 could occur. Conversely, a break below the immediate support at $3.000 might lead to a price decrease towards the main support level at $2.860. To confirm bullish or bearish scenarios, monitoring for valid breakouts of these levels along with volume analysis and other technical tools is essential.

Buy Trade Strategy for TON: Backing the Telegram-Driven BlockchaDescription:
This trading idea focuses on TON (The Open Network), a next-generation blockchain originally developed by Telegram and now maintained by the open-source community. TON stands out for its high scalability, ultra-fast transactions, and integration with Telegram’s massive user base, which provides it with a unique growth advantage. The network supports smart contracts, DeFi applications, NFTs, and more, making it a comprehensive blockchain ecosystem. With increasing adoption and real-world utility driven by Telegram’s influence, TON is positioned as a strong contender in the race for mainstream blockchain adoption.
Still, it is crucial to keep in mind that the cryptocurrency market is highly volatile. The performance of TON can be impacted by regulatory actions, market sentiment, and technological developments. Therefore, any investment in TON should be backed by careful research and appropriate risk management.
Disclaimer:
This trading idea is provided for educational purposes only and should not be taken as financial advice. Investing in cryptocurrencies, including TON, involves significant risk, including the possibility of total capital loss. Always conduct independent research, assess your risk tolerance, and seek advice from a certified financial advisor before investing. Past performance does not guarantee future results.

DeGRAM | TONUSD forming the new triangle📊 Technical Analysis
● Price exited a 6-month falling wedge, retested the purple breakout line near $2.90 and is printing successive higher lows inside a nascent up-sloping channel.
● The wedge’s 0.618 projection and horizontal cap align at the $3.95 resistance band; holding above the $2.89 support trend keeps that target in play, with the long-term ceiling at $5.99 next.
💡 Fundamental Analysis
● Telegram has begun routing merchant payments through TON rails, broadening real-world demand for the token.
● Recent on-chain data show earlier long-term holders taking profit near $5 yet buyers quickly absorbed supply, signalling underlying bid strength ahead of another push higher.
✨ Summary
Buy dips toward $2.90-3.00; as long as the breakout line holds, look for $3.50 then $3.95. Bull thesis void on a weekly close below $2.82.
-------------------
Share your opinion in the comments and support the idea with a like. Thanks for your support!
Toncoin 5X Lev. Full PREMIUM Trade-Numbers (PP: 1480%)This chart setup with leverage originally came to my attention around 15-April. Seeing the same market conditions now after some consolidation and a small higher low makes the setup stronger.
This is an easy one. I think it has a good chance of success and the timing is about right.
Just make sure your position is safe (low leverage) and you should do fine.
Full trade-numbers below:
_____
LONG TONUSDT
Leverage: 5X
Entry levels:
1) $3.10
2) $2.85
3) $2.65
Targets:
1) $3.23
2) $3.75
3) $4.28
4) $4.62
5) $5.32
6) $6.01
7) $7.01
8) $8.28
9) $9.68
10) $10.5
11) $11.9
Stop-loss:
Close weekly below $2.50
Potential profits: 1480%
Capital allocation: 4%
_____
Leveraged trading can be a lot about position managing and capital allocation, if you are going for those very small and short-term swings. If you are looking for long-term trade setups like I do, timing and entry prices are king. The top priority.
I think both are excellent here but you know anything goes. While I like a high accuracy/hit rate, the market is not without risk and anything can happen at any time. Not all trades are won but it can be good this time.
With the right capital allocation, mindset and planning, you can't go wrong.
As the market turns bullish, as soon as the up-move starts, you have secured an awesome position.
Thanks a lot for your continued support.
Namaste.

TON on DailyFollowing an important distribution of TON, I have noticed how in the last period it is in a sideways phase, which could herald a Wyckoff accumulation.
Below I have made the relevant changes and included tickers so that you too can view them.
As always, you can copy and follow my setup.
Be careful out there.
Happy trading.

Lingrid | TONUSDT Buying OPPORTUNITY in the ACCUMULATION Zone OKX:TONUSDT saw a sharp sell-off from the double top near 3.59, but the price rebounded from the 2.88 support zone, forming a potential accumulation structure. The current setup suggests a consolidation just below the key resistance at 3.25, aligning with the descending trendline. A breakout above this level would confirm bullish momentum and open room for further upside. Until then, the 3.03–3.05 area remains a tactical range for accumulation.
📈 Key Levels
Buy zone: 3.00 – 3.05
Buy trigger: breakout above 3.25 resistance
Target: 3.25
Sell trigger: failure to hold above 3.00
💡 Risks
Continued rejection at the descending trendline caps upside.
A clean break below 2.88 would invalidate the bullish scenario.
Market-wide volatility may distort breakout signals.
Traders, if you liked this idea or if you have your own opinion about it, write in the comments. I will be glad 👩💻

#TONUSDT ( red line )For ideal growth,
it should be able to break the main red resistance line and band
Hoping to break this line

Toncoin (TON): One Good Long Position Can Be Taken HereToncoin has a good chance of a breakout happening soon, where we are seeing a good 7:1 RR trade that can be taken on bigger timeframes. Toncoin is one of the coins that we think has yet to reveal its potential ATH....
More in-depth info is in the video—enjoy!
Swallow Academy

Is This Brutal Sell-Off Finally Setting Up a Reversal?Looking at TON here and I'm seeing some interesting developments that caught my attention. We've been in this brutal downtrend since the November highs around $7, but the price action in this current zone is telling a different story.
The Setup:
Price has been getting absolutely hammered from that strong supply zone I've marked around $6.50-7.00. Every bounce into that area got sold hard, which is classic distribution behavior. But now we're sitting in what I believe is a critical accumulation zone between $2.50-3.50.
What I'm Watching:
The multiple trend line breaks and retests suggest we might be building a complex bottom here. That descending wedge pattern is textbook - these usually resolve to the upside, especially when you're this oversold on higher timeframes.
The fact that we're holding above the $2.50 psychological level despite all the selling pressure is actually pretty bullish. Smart money doesn't let good projects stay this beaten down forever.
My Take:
I'm cautiously optimistic here. The risk/reward is starting to favor the bulls if you're thinking longer term. That green arrow I've drawn isn't just wishful thinking - the technical setup supports a potential move back toward the $5-6 range over the coming months.
Risk Management:
Obviously this could still leg down further. Crypto markets are brutal and TON isn't immune to broader market weakness. But if Bitcoin cooperates and we start seeing some alt season momentum, this looks like it could be one of the better setups.
Not financial advice, just sharing my chart reading. Always size your positions appropriately.

#TON/USDT#TON
The price is moving within a descending channel on the 1-hour frame, adhering well to it, and is heading towards a strong breakout and retest.
We are experiencing a rebound from the lower boundary of the descending channel, which is support at 2.97.
We are experiencing a downtrend on the RSI indicator, which is about to break and retest, supporting the upward trend.
We are looking for stability above the 100 Moving Average.
Entry price: 3.02
First target: 3.05
Second target: 3.15
Third target: 3.22

TON. USDTToncoin was one of the best projects that managed to grow well.
due to Pavel Durov's mistake (trip to France), the trust in this cryptocurrency has become less than ... on a sheep.
And now it is trading below the initial placement price.
But at the moment it has managed to break the downward trend line on the daily time frame.
If it can break through the price of $3.30 with force, it can reach the targets
$3.6
$3.8
and even higher.

looking at TON(4H)TON after a sharp decline has formed a small consolidation.Now we are in the middle of consolidation.Just should wait and watch what is going to happen later.We are waiting the price to touch up border or decline to touch the lowside again.

TON/USDT Technical Analysis – 1H TimeframeCurrently, the price is consolidating around the $3.10 level, testing a key resistance zone at $3.164, which has yet to be decisively broken. This level now serves as a significant short-term resistance.
🔹 Bullish Scenario (LONG Opportunity):
If the price manages to break above the $3.164 resistance with strong momentum and confirms the breakout through a successful retest, a long entry could be considered. In this case, the bullish structure would target the next major resistance area around $3.434, which aligns with a previous high and psychological level.
🔸 Bearish Trap Scenario (Fake Breakout):
If the price fails to hold above $3.164 and drops back into the red demand zone around $3.05–$3.07, we might witness a fake breakout or liquidity grab. This could trigger stop-loss hunts before a potential reversal. A bullish reaction from this demand zone could still offer a solid long opportunity with tight risk management.
📊 Volume Observation:
Noticeable buying volume has appeared near recent lows, indicating possible accumulation. However, confirmation through price action (breakout or bullish reversal signal) is required before entering a trade.

Lingrid | TONUSDT buying OPPORTUNITY from SUPPORT zoneOKX:TONUSDT found support just above the $3.00 psychological level after a double top formation triggered a sharp correction. Price is currently hovering near the upward trendline and may enter a consolidation phase before attempting a rebound. A successful break above the descending trendline could open the way toward $3.30.
📌 Key Levels
Support: $3.00
Resistance: $3.30
Potential Breakout Trigger: Descending trendline above $3.15
⚠️ Risks
Failure to hold $3.00 could expose the $2.78 support
Bearish continuation if the descending trendline resists breakout
Market indecision near psychological levels may lead to volatility
Traders, if you liked this idea or if you have your own opinion about it, write in the comments. I will be glad 👩💻

Interesting moment for try to Sell TON. Interesting moment for try to Sell TON. The 3.35 the local horizontal level. The current point can be local low. The logically we can try to take the long from current price with stop by previous low. But I have small idea that this point local low point will not formed and we still move to down. It is why I put the stop around 3.35 level, because it is first long goal if price move to up. Will see...

Today's signal is TONHello friends
Given the price growth after reaching resistance, it has entered a correction, which provides a good opportunity to buy in stages and with capital management and move to the specified targets.
*Trade safely with us*
