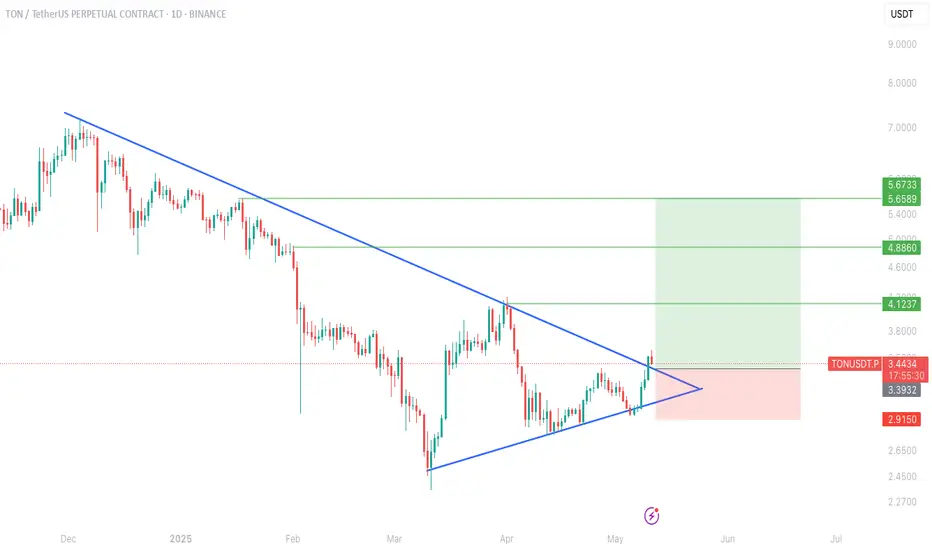
TON breakout alert!!CRYPTOCAP:TON chart Update!
TON has officially broken out of a multi-month symmetrical triangle on the daily chart, signaling a potential trend reversal after a long downtrend.
📈 Clean breakout above descending resistance
🔼 Entry triggered around $3.44
🎯 Targets ahead:
TP1: $4.12
TP2: $4.88
TP3: $5.67
As long as the price stays above the breakout zone, bulls are in control. A successful retest could offer another great entry!
If you find this analysis helpful, please hit the like button to support my content! Share your thoughts in the comments, and feel free to request any specific chart analysis you’d like to see.
Happy Trading!!
TONUST trade ideas
TON Bullish📉 TON/USDT 4H Analysis:
After breaking below the key support at 3.729, TON saw a sharp drop toward 2.849, where it found a strong bullish reaction. A short-term bullish correction is currently underway, but resistance at 3.3–3.4 and the 200 EMA may limit further upside. If TON fails to break through, it could retest 2.849 or drop to the 2.505 demand zone. For a true bullish reversal, a confirmed breakout and consolidation above 3.729 is essential.

TON long swing long on TON LTF range high reclaim -> run it into range mid HTF -> range mid reclaim 3.75 next after range highs

Toncoin: Still Early But Bullish (PP: 253% & 429%)Believe it or not, it is till early for Toncoin and this is good news for buyers. It is still early but very bullish.
The low here happened 10-March 2025, which means that buyers were present in April and ended up supporting the project and not letting it produce a lower low. This reveals how strong this pair will grow in this bullish cycle.
The current weekly candle is trading above the two previous weeks open and close. This little simple signal reveals that the continuation of the initial bullish reaction when the low was hit is about to happen, or you could, it is the start of the next bullish wave.
The main target I am showing here is $11.95 for a nice 253% profits but there is more. This is the final target only because I am using the linear chart. There is also $17.88 for a great 429%. These targets should hit easily as the bull market develops, expect growth long-term.
It is still early for Toncoin, early but bullish.
Thank you for reading.
Namaste.

TONUSDT Built a Fresh Up Trend!!!Hey Traders, in today's trading session we are monitoring TONUSDT for a buying opportunity around 3.20 zone, TONUSDT is trading in an uptrend and currently is in a correction phase in which it is approaching the trend at 3.20 support and resistance area.
Trade safe, Joe.

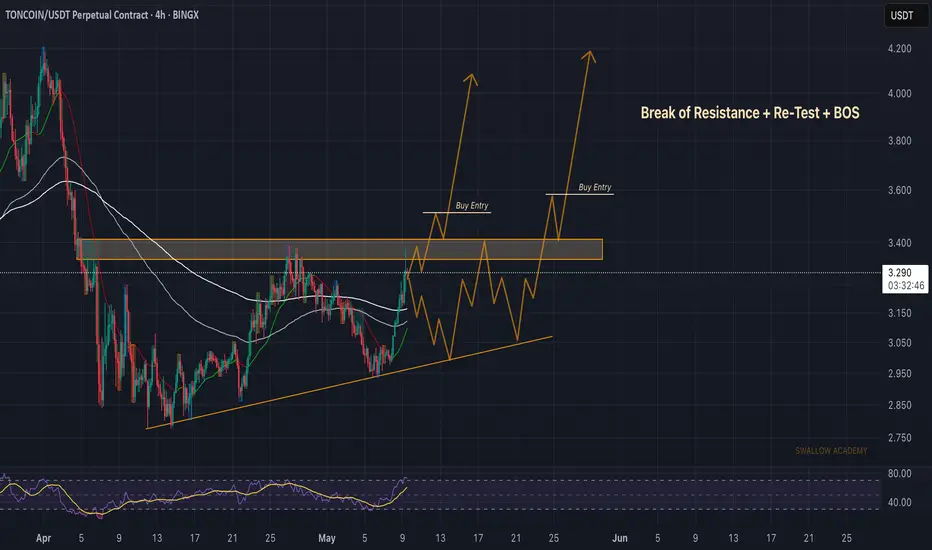
Ton Coin (TON): Looking For Break of Structure | Long PositionToncoin caught our attention where the price has reached a local resistance zone where we might be seeing some sideways movement for some time but eventually we are looking for a break of this zone (resistance).
Once we get the break of that zone, we are going to look for a proper retest and then a smaller BOS. That would be our entry for long as well!
Swallow Academy
TON/USDT : The Next Bullish Rally Ahead? (READ THE CAPTION)By analyzing the #Toncoin chart on the 3-day timeframe, we can see that the price is currently trading around $3.00, which is approximately 60% below its all-time high of $8.20. If Toncoin can hold above the $2.80 level, we may expect further bullish momentum in the mid-term.
The next potential upside targets are $3.39, $3.64, $4.20, and $4.66.
Please support me with your likes and comments to motivate me to share more analysis with you and share your opinion about the possible trend of this chart with me !
Best Regards , Arman Shaban

TONUSDT 1D AnalysisTON ~ 1D Analysis
#TON Buy after successfully breaking this resistance line with a short term target of at least 15%+ from here.

TON is waking up. The question is: are you ready?TON is loading for a massive move. Smart money tapped the 1M OB — eyes on 4.5 and 7.5 🚀
Are you early or gonna FOMO later?
1M analysis /Entry 1 D
ICT analysis and self learn analysis
BOOST AND JOIN
#TON #crypto #smartmoney #tradingview #altcoins #bullish #TONcoin #priceprediction #ICTstyle

Lingrid | TONUSDT market Remains in the ACCUMULATION PhaseOKX:TONUSDT is still locked within a long-term corrective channel, with price gradually grinding along the lower boundary. Accumulation appears underway near the $2.50 zone, suggesting growing demand. The structure hints at a potential breakout, but momentum remains weak for now.
📌 Key Levels
Support zone: 2.49 – 2.00 (BUYING area)
Breakout target: 4.00
Invalidation level: Below 2.00
⚠️ Risks
Persistent downward trendline pressure
Lack of strong bullish volume confirmation
A daily close below $2.49 could signal renewed downside
Traders, if you liked this idea or if you have your own opinion about it, write in the comments. I will be glad 👩💻

TON TON TONHello friends
Due to the entry of buyers and the registration of higher ceilings and floors, we can buy in the direction of the trend and with capital and risk management within the specified ranges and move to the specified targets.
*Trade safely with us*

Lingrid | TONUSDT pullback Approaching Psychological LevelThe price perfectly fulfilled my last idea . It reached the target. OKX:TONUSDT is pulling back after testing the upper resistance area near 3.40. Price is now moving toward a key support zone around 3.00, where the downward trend-line intersects horizontal structure. If bulls defend this level, the chart suggests a possible bounce back toward 3.25. The bullish scenario remains active as long as the trend-line holds.
📈 Key Levels
Buy zone: 3.03 – 3.06
Buy trigger: bounce from trend-line support
Target: 3.25
Sell trigger: break below 3.03
💡 Risks
Loss of 3.03 could lead to a drop toward the 2.78 support.
If the bounce lacks volume, recovery may be weak.
Watch for fakeouts near the trend-line—confirmation is key.
Traders, if you liked this idea or if you have your own opinion about it, write in the comments. I will be glad 👩💻

TON Would Hit 13.29TONUSDT is a promising buy on the spot market, given its bullish technical structure and strong fundamentals tied to Telegram’s ecosystem.
$13.29 take-profit target is ambitious but achievable in a 2025 bull run, especially with catalysts like NFT integration and Bitcoin’s rally.
Only for SPOT!!
Events for consideration:
NFT Integration : Telegram’s launch of stickers as NFTs in April 2025 is a positive catalyst, potentially increasing TON’s utility and user engagement.
Pavel Durov’s Move : Durov’s relocation to Dubai in March 2025 fueled a 50% price surge, signaling confidence in TON’s future.
Market Activity : A 35% increase in open interest and 2.97 million TON traded in 24 hours (April 2025) reflect strong market interest.
Crypto Market Rally : Bitcoin’s rise to $90,000 and altcoin momentum in April 2025 create a favorable environment for TON’s price growth.
Bearish Risks : Negative funding rates and potential long liquidations at $2.54 (March 2025) highlight short-term volatility risks.

Wow! Toncoin Amazing Opportunity, The Market...This is what I love about the Cryptocurrency space, it is awesome. The market always gives us tons of time and endless opportunities to make up for any novice mistakes.
Did you miss the bottom, you say? Not true! Just like many other pairs, TONUSDT—Toncoin—is still trading within its long-term buy-zone. This means that there is still time to buy while prices are low trading at support. The best time possible.
Which other market gives such amazing opportunity I just don't know nor care, because we are here now and Cryptocurrency is also here and here to stay.
Traditional traders have to go through coffee and corn looking for a very hard to achieve 1% with a million dollars to be able to make some profits. They have to read bible sized books just to get through the filter that will give them the tricks on how to profit from such unpredictable markets and guess what? When you get the trick, you know it works and it is working, politics gets in the way and messes everything up.
Then the profits potential are so low, that you have to worry about spread, liquidity, fees and even the brokers commission, it makes you into a stingy person; this is not a problem with Crypto.
Profits potential with Cryptocurrency is so high and so easy to spot that you can even allow yourself to make mistakes. When the bullish wave is in, you have so much generosity from the market than rather than worrying about brokers commissions and fees you will be giving hundred dollars tips.
Ok, let's get serious now. It is not like the Cryptocurrency market is paying me to write this.
Let's focus on the chart.
It is the same chart I shared with you for you some week ago. It is the same exact chart but prices are a bit higher that's all.
The classic ABC correction is enough for me to know that a bullish impulse, 1-2-3-4-5, will follow. That's how Elliott Wave Theory works. After a correction, an impulse, after an impulse a correction, back and forth.
So you only need to be able to spot a correction and you know what will happen next.
I know the correction is over based on my observational experience so, prepare for massive growth. It is still early for this pair.
You will notice this phenomena. Some pairs will be more advanced and you think you missed the train, but right "next door" you find another pair that is still trading low. If a pair is already moving, just let it go, always focusing on buying low near support.
The moment you decide to buy the high one because it is growing and will continue to grow, that's when the correction out of nowhere comes. If you buy near support, your risk stays low. If you buy on an impulse and without a plan whatever is moving, this impulse is the clear proof that the action you just made will not produce positive results.
Step back, watch and follow.
I am the Master of the charts.
Namaste.

Lingrid | TONUSDT support REBOUND Confirms POSSIBLE Reversal The price has perfectly fulfilled my previous forecast . OKX:TONUSDT market bounced off the support level and is now showing clear signs of reversal. Additionally, price action broke and closed above the psychological level at 3.00, confirming bullish momentum. The price action is creating an ABC pattern, suggesting the market may reach the upper border of the channel. Currently, the price is testing the weekly high level, and from this zone, a short-term pullback may form. If the price retraces toward the swap zone, we can expect it to rebound and continue pushing higher. We should look at the current test of the weekly high for signs of temporary resistance before the anticipated pullback. My goal is resistance zone around 3.40
Traders, if you liked this idea or if you have your own opinion about it, write in the comments. I will be glad 👩💻

#TON/USDT#TON
The price is moving within a descending channel on the 1-hour frame and is expected to continue lower.
We have a trend to stabilize below the 100 moving average once again.
We have a downtrend on the RSI indicator, supporting the upward move with a breakout.
We have a resistance area at the upper limit of the channel at 3.73.
Entry price: 3.69
First target: 3.60
Second target: 3.515
Third target: 3.40

Potentially Sell position There is supply area around 3.21 and the volume is falling. I expect heavy falling to around 2.5 as demand area.

TradeCityPro | TON: Eyeing Breakout in Telegram’s Hottest Token👋 Welcome to TradeCity Pro!
In this analysis, I want to review the TON coin for you. This coin is for the Telegram social network, and in 2024, due to airdrops like Notcoin and Hamster that trended, it became very hyped and widely talked about, and the TON blockchain experienced significant growth.
🔍 Currently, the NFT market has also launched on this network, which has prevented this coin from dropping. This coin, with a market cap of $7.78 billion, is ranked 18th on CoinMarketCap.
⏳ 4-Hour Timeframe
In the 4-hour timeframe, as you can see, after the downtrend that the price had, there was a bullish move following the news of Pavel Durov going to Dubai and leaving France, and now the price is in a correction phase again.
⚡️ Currently, a 4-hour range box has formed, with the bottom of this box at the 2.851 zone and the top at 3.216. There's also a mid-line within this box at 3.044, which the price has broken and is moving toward the 3.216 ceiling.
✔️ If the price movement continues toward the top of the box with this momentum and high buying volume, the likelihood of breaking the 3.216 area will increase significantly. So I suggest that with the breakout of this level, you try to have a long position open.
📉 For a short position, if the price gets rejected from the top of the box, you can enter a trade with a trigger on a lower timeframe. Otherwise, the first trigger is the break of 3.044, and the second trigger is the break of 2.851.
🔼 For a long position, the RSI oscillator is near the Overbought area, and if it enters Overbought, we can expect a sharp bullish move.
📊 Market volume is currently in favor of buyers and is increasing. If volume increases and RSI enters Overbought, you can place a stop buy order above the 3.216 level so that if there is a sharp breakout of this level, your position gets triggered as well.
📝 Final Thoughts
This analysis reflects our opinions and is not financial advice.
Share your thoughts in the comments, and don’t forget to share this analysis with your friends! ❤️

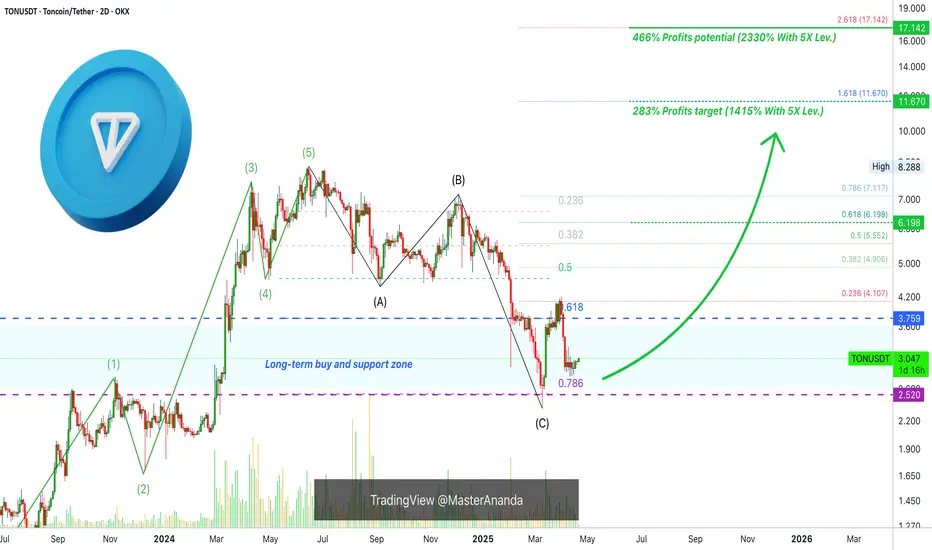
Toncoin Buy-Zone, 466% Rise Starts Now (2330% With 5X Lev.)Truly, opportunities like this do not present themselves very often. Toncoin is now trading within a long-term buy-zone with a higher low bullish signal confirmed.
This signal is confirmed based on multiple TA factors, want to look at those?
— There is a perfect ABC correction pattern.
— There is strong buying at the correction C wave low.
— The same level were support was found was also resistance back in December 2022, Jan., Feb., & March 2023, as well as October and November 2023. A classic strong, long-term resistance level turned support.
— Marketwide action is pointing up.
— The fact that Notcoin is bullish and rising, a related Cryptocurrency, lends additional support to the bullish bias on this pair.
This is not all, a new bullish impulse is also predicted based on the very advanced system of Elliott Wave Theory, the Wave Principle.
» Toncoin (TONUSDT) Trading Strategy
Easy yet strong and high potential for profits target can be seen on the chart for your convenience, the strategy is very simple; leverage or spot, you simply buy and hold, the market will take care of the rest. Once the action goes green and resistance is met, that's the time to take profits and move on to the next trade. You can always comeback when there is a retrace. The market moves in waves.
Prices will grow, yes, but then they will move lower in search for support. Once this drop happens, that's the time to enter again for another LONG. Just as it is now, there was bullish growth followed by a correction, when the correction hits bottom, we go LONG. When the market peaks, we go SHORT (sell—take profits).
Thanks a lot for your continued support.
The correction is over, it is the best time possible to buy and hold.
Focus on the long-term. The market offers endless opportunities. The only way to lose is if you give up. If you made a mistake, just try again. Cryptocurrency is here to stay.
Namaste.
Global Market Overview. Part 4.3: TON
TON Coin: The Undervalued Giant with Telegram’s DNA
(Previous article: )
It’s time to talk about an asset that I rank alongside Solana, Ethereum, and Bitcoin — despite its relatively modest market cap.
I’m talking, of course, about TON Coin.
And here’s why I fully believe in its potential — why TON isn’t just another altcoin, but a project with vision, architecture, and a mission that most assets on the market sorely lack.
A Project Born from Telegram’s Philosophy
TON is not a speculative startup. It’s a continuation of Pavel Durov’s vision — a man who’s already proven he can build digital ecosystems with hundreds of millions of users, and do it without bowing to outside pressure.
Yes, the road was rough:
During its ICO in 2018–2019, TON faced lawsuits in the U.S. totaling over $100 million
American regulators effectively delayed the launch, fearing the uncontrollable rise of a blockchain funded by U.S. citizens
The project had to abandon its original launch plan — but it didn’t disappear. It simply rebooted in a new form: as a public blockchain network
Today, Toncoin exists as part of Telegram’s Web3 infrastructure, and its tokenomics are already integrated into the app.
This is not some "future roadmap" — it’s already live:
Payments in TON inside Telegram
Web3 tools for creators
Bots, wallets, NFTs, and mini-apps running on TON
All within the world’s most popular messaging platform
Telegram Isn’t Just an App — It’s a Movement
Here’s the key: Telegram is no longer just a messenger. It’s a new type of global media platform.
In 2024, Telegram topped download charts worldwide — including in the U.S., Latin America, Europe, and the Middle East
After Pavel Durov was detained in France at the request of intelligence agencies — following Telegram’s refusal to cooperate with authorities and hand over user data — the app became a symbol of digital freedom
It wasn’t a scandal — it was a marketing triumph. App installs surged, and interest in TON soared
TON isn’t just a token — it’s Telegram’s payment layer.
And that will matter enormously in the long run.
Weak Hands Are Gone. Strong Hands Are Entering.
TON didn’t go parabolic like Solana or Doge did in their early days.
And that’s a good thing.
The speculators looking for quick flips are gone
The builders and long-term thinkers — the ones who recognize real-world utility and deep integration — are quietly accumulating now
In my view, the current price zone is one of the best accumulation opportunities in the entire market:
Market cap is low by mainstream crypto standards
The tech is live and working
The ecosystem is growing
Telegram is expanding rapidly in the U.S.
Early-stage discussions about ETF approval for TON are already happening (informally — but significantly)
My Strategy for TON
I’m buying TON for the long haul.
Not for a week. Not for a month.
But for at least 12–18 months.
Because:
A 3x–5x return is absolutely realistic
The product is integrated into an ecosystem used by hundreds of millions daily
Pavel Durov isn’t some anonymous dev — he’s a visionary who’s already built a global-scale digital tool
Even without major news, TON has a base case target of $3–3.50.
If we get ETF approvals or deeper integration into Telegram Premium, the upside could be far greater.
For Futures Traders
Even if you're not a long-term holder, there are clear opportunities here:
The current $1.80–2.00 zone is ideal for tactical entries
$3.50 is technically reachable even without a big news catalyst
Moderate leverage and defined risk can work well — especially if you're not chasing tops
A Critical Reminder
Fundamental analysis isn’t about timing RSI.
It’s about understanding what an asset means in the broader context of economy, media, politics, and tech.
Right now, the market is noisy and turbulent:
Tariff war tensions
China’s retaliatory measures
Elevated volatility
Media hysteria
Political manipulation
But in all this noise, it’s easy to miss the signal:
Crypto is maturing.
And the U.S. wants control — not through brute force, but through smart moves: by capturing infrastructure and acquiring strategic assets.
Until they tighten the noose with heavy-handed regulation — we have a first-mover advantage.
Final Thought
TON Coin is not a hype play. It’s a strategic asset of the next crypto economy.
It’s tied to Telegram
It doesn’t rely on memes
It’s integrated into a real, living audience
It’s supported by a team that’s proven itself
If you want to argue — drop your thoughts in the comments.
If this article resonated — show some love.
As always, I don’t offer investment advice. I just share what I’m doing.
And TON is in my portfolio.
Right now. And for the future.

Lingrid | TONUSDT Signs of REVERSAL at KEY Demand Zone OKX:TONUSDT market continues to consolidate after the sell off in the market. However, the market currently sits at the demand zone and it's giving signs of potential reversal. The price is in the accumulation phase around the 3.00 level. The price has decelerated at this zone followed by bullish divergence meaning more buyers are stepping in. The market has twice respected the 2.70 - 2.80 support zone with the last 2 monthly candles testing and closing above it. I expect the market to move to higher levels if the price does not drop due to sudden negative news. This accumulation pattern at key technical support suggests patient buyers may soon be rewarded. My goal is resistance zone around 3.450
Traders, if you liked this idea or if you have your own opinion about it, write in the comments. I will be glad 👩💻

TON WILL PAMPCurrently, we can see that TON is accumulating.
Positives:
Clear levels
Low volatility
Near the 0.786 Fibonacci level
Higher lows (HL)
The price may continue to accumulate or pump from the current level.
Toncoin: Resistance Turned Support —The Internet 2.0Here we have a classic dynamic within the Cryptocurrency market. A resistance level once conquered, becomes a support level when a pair enters a correction.
In December 2022 Toncoin peaked after finding resistance. This level turned out to be a strong resistance and remained valid for more than a year. There were several failed attempts to break this level in late 2023 and in February 2024. Finally, it was conquered in March 2024 with the start of a major bullish jump... Things change.
After a bullish wave invariably a correction develops. How far down will prices go?
A previous strong resistance can work as a strong support. This support zone has now been activated in 2025 and it holds. This is a very important zone and can be used to buy and accumulate.
Whenever TONUSDT trades on the orange zone on the chart, buyers should buy and can buy, this zone can never break. This price range worked as resistance for an entire year and three months, in reverse, it will stop a drop on its track and can be the launchpad for the next bull market phase.
This is it. Support has been found.
Notice the strong rise in buy volume in March 2025, right when this support zone is hit/activated. Notice the super high bearish volume afterward, yet Toncoin remains trading within a higher low.
This is it, that's the signal. The low is in.
The next move will be up and up we go.
I hope you find this article in good timing.
Good entry timing. Great prices.
The time is right and the time is ripe.
Crypto is about to explode. The biggest explosion in the history of finance.
The evolution of money.
The Internet 2.0.
Namaste.
