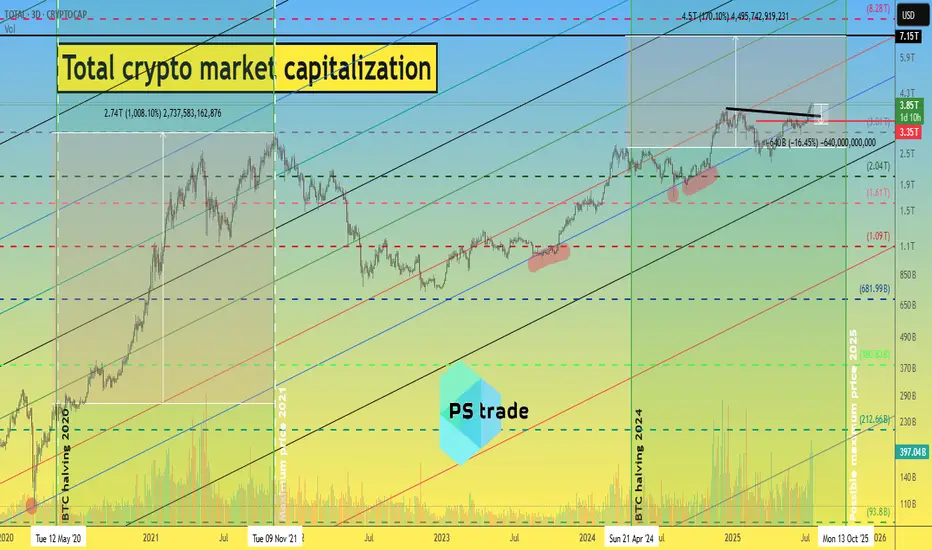
What to expect in the crypto market until 2026 ?!📈 Today, we will look at the graph of the total capitalization of the cryptocurrency market, as well as the implementation of our ideas from 2022 to 2025.
At that time, the cryptocurrency market was in a total depression, there was no talk of BlackRock or MicroStrategy buying cryptocurrencies, and we stubbornly wrote that this was the bottom... and then a miracle happened)
During this time, the total capitalization of the crypto market grew 5 times from $800 million to $4 billion.
ℹ️ You can find all posts in the channel by searching by date:
1️⃣ 18.11.22 - “How much can the crypto market capitalization grow by the end of 2025?”
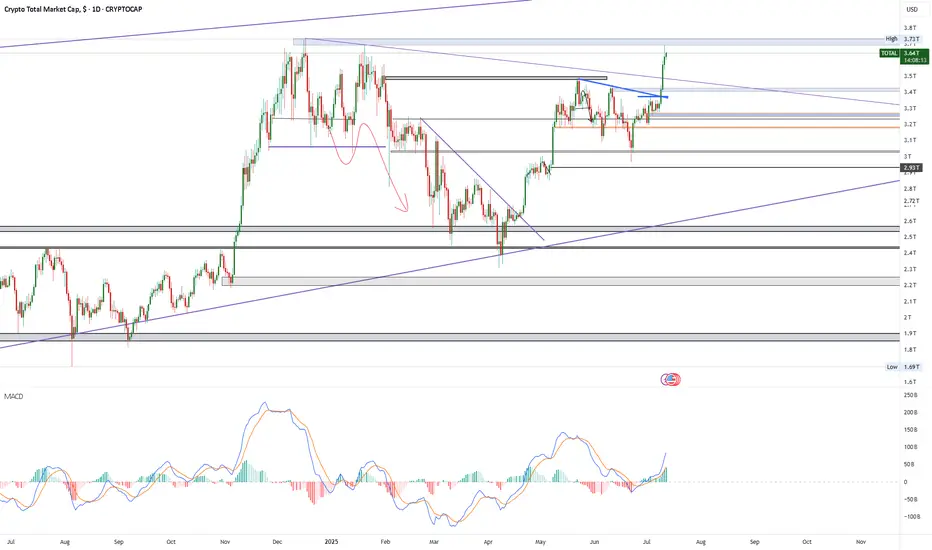
The growth momentum is slowing down, but the following ideas give hope.
2️⃣ December 30, 2022 - “Plans for 2023-25”
If we are to believe this fractal, which has been working for over 2.5 years, then all the most interesting things are still ahead.
3️⃣ 29.02.2024 - “What to expect from the crypto market in 2024-26”
At the beginning of 2024, the previously published fractal was slightly adjusted to the market situation.
4️⃣ 04.03.2025 - “The total capitalization of the crypto market is on the verge of a foul.”
Then, despite the market depression and a lot of negative news, the total capitalization still managed to stay above the blue trend line.
📊 Cryptocurrency market capitalization as of 22.07.25:
◆ Bitcoin - $2.36 trillion
◆ Ethereum - $442 million
◆ Ripple - $206 billion
◆ SOL and BNB - $110 billion each
◆ USDT and USDC - $162 billion and $65 billion, respectively.
In total, this is $3.45 trillion out of $3.89 trillion of the total crypto market capitalization.
♎️ Too much capital is concentrated in the top 7 projects; we need a process of capital flow and the launch of exponential growth. Especially since all of the above fractals “suggest” that the time has come and anything is possible.
🔃 The total capitalization of the crypto market must continue to remain above the blue trend line, i.e., it cannot be adjusted by more than -13-16% to $3.25-3.35 trillion.
Roughly speaking, the price of CRYPTOCAP:BTC cannot be adjusted by more than -10% due to its high dominance at the moment. (Such an adjustment of the #BTCUSDT price fits into the scenario we published a few days ago.)
_____________________
Did you like our analysis? Leave a comment, like, and follow to get more
TOTAL trade ideas
TOTAL CRYPTO MARKET CAP expected to hit $6 Trillion!The Crypto Total Market Cap (TOTAL) has been on a Channel Up since the 2022 market bottom and since the April 07 2025 Low (Higher Low for the pattern), it's initiated the new Bullish Leg, already turning the 1W MA50 (blue trend-line) into Support.
As long as this holds, we expect it to complete a +270% rise from the August 05 2024 Low, similar to the Bull Cycle's first Green Phase, and reach at least a $6 Trillion Market Cap!
More importantly, we expect this final part (blue ellipse) to be what is commonly known as an Altseason, where the lower cap coins show much higher returns and disproportionate gains to e.g. Bitcoin.
-------------------------------------------------------------------------------
** Please LIKE 👍, FOLLOW ✅, SHARE 🙌 and COMMENT ✍ if you enjoy this idea! Also share your ideas and charts in the comments section below! This is best way to keep it relevant, support us, keep the content here free and allow the idea to reach as many people as possible. **
-------------------------------------------------------------------------------
💸💸💸💸💸💸
👇 👇 👇 👇 👇 👇

The Crypto Era- Just updated an old chart!
- If you want to know where we stand, it's clearly outlined on the chart.
Some older Analyses :
- HODL strong!
Happy Tr4Ding !

The SqueezeWhile it is logical to assume that the bulls are the ones about to get squeezed, I am going to be a contrarian and bet on the SHORTs getting liquidated, big time.
Good afternoon my fellow Cryptocurrency trader, how are you feeling this Saturday?
Every now and then, every once in a while the market enters a fight between down and up. When tensions rise, when people become anxious, when greed is strong, that's the time for a market squeeze to develop.
Seeing how good Bitcoin is doing, the strong Ether advance, how the altcoins are moving ahead and the rest, it is easy to rationalize that the market will squeeze all the over-leveraged LONG traders. I will repeat myself again, this is a SHORT squeeze.
Let's wait and see. Prices are going up. 1 Billion in liquidations coming next.
Let the bears run. Let's us start a mini bull-run phase.
Namaste.

MARKETS week ahead: July 20 – 26Last week in the news
Resilient inflation and the jobs market in the US supported further investors sentiment, bringing equities to higher grounds. The new all time highest level was reached by the S&P 500, which is closing the week at 6.296. The US Dollar gained in value during the week, however, the price of gold remained relatively flat, closing it at $3.349. Strong macro data decreased expectations among market participants over the Fed's rate cut, bringing 10Y US yields down to 4,42%. The new Genius Act was passed in the U.S. House, supporting the price of BTC to hold at higher grounds, above the $118K.
The U.S. economic data in focus last week was led by June inflation figures. Headline inflation remained relatively stable, rising 0.3% for the month and 2.7% on a yearly basis, both matching market expectations. Core inflation came in at 0.2% for the month and 2.9% annually, slightly below forecasts by 0.1 percentage points, though still elevated. The Producer Price Index (PPI) was flat in June (0.0%), with core PPI also unchanged. On an annual basis, PPI rose by 2.3%, and core PPI by 2.6%. Meanwhile, retail sales in June outperformed, climbing 0.6%, well above the expected 0.1%. Another positive news came from the University of Michigan preliminary Consumer Sentiment Index for June, where five-year inflation expectations eased to 3,6% (down from 4% posted previously), while one-year expectations declined to 4,4% from the previous 5%. Resilient macro data decreased market expectations over the potential Feds rate cut in September to 50% from previous 70%, as per data shown in CME FedWatch Tool.
The Genius Act was passed by the U.S. House on July 17th, after its approval from the Senate in June. The bill represents an important milestone for the crypto market, as it sets a comprehensive federal standard for stablecoins, clearing the way for banks and fintechs to issue them under clear reserve and audit rules. Among others, it allows permitted institutions to issue U.S. Dollar-pegged stablecoins, backed 1:1 by liquid reserves such as cash or Treasuries. It also mandates strict rules for reserves, custody and consumer protection in terms of full reserves, monthly disclosures, segregation of assets and priority in bankruptcy, aimed to boost consumer confidence and financial stability.
Weekly news on trade tariffs include a report by the Financial Times indicating that the US President had intensified his trade demands on the European Union after weeks of negotiations. According to the report, Trump is now pushing for a minimum tariff of 15% to 20% on imports from the EU, escalating further trade tensions.
Effective July 23, the composition of the S&P 500 index will be adjusted. A tech company Block will be added to the index, replacing energy company Hess, which will be removed. Following the announcement, Block’s shares jumped 10% on Friday.
Denmark is the first country in the world which passed the legislation by which citizens of their country own the copyright to their own face, voice and body. With this move Denmark Government is trying to protect its citizens from AI deepfakes, and similar misuse of data, pictures and voices of its citizens, without an explicit consent.
CRYPTO MARKET
While the previous week was the one dedicated to BTC, this week belongs to altcoins, who drove total market capitalization to higher grounds. The adoption of the Genius Act by the U.S. House was the main trigger behind the strong demand for altcoins. The crypto market gained a total $181B in market cap, increasing it by 5% on a weekly basis. Out of $181B, BTC participated with “only” $11B. Daily trading volumes were also increased to the level of $333B, from around $300B traded a week before. Total crypto market capitalization from the beginning of this year currently stands at 17%, with a total funds inflow of $561B.
This week belongs to ETH and other altcoins, which were major weekly gainers. ETH managed to add $74B to its market cap, increasing it by an incredible 20,8%, reaching levels of $3,5K. XRP was also one of coins with a gain above 25%, adding total $41B to its market cap. This week, market favourite Solana added $9,4B to its capitalization, increasing its total value by 11%. BNB managed to collect new $6,3B, surging by 6,6%, while DOGE added $6,7B to its market cap, which was increased by 23%. Among significant gainers ADA should also be mentioned, with an weekly increase in its cap by $4,2B or 17%.
A relatively calmer week when coins in circulation are in question. The main weekly difference relates to ZCash which withdraws 3,8% of its coins from the market free float. At the same time, Solana was the one to increase its number of circulating coins by 0,4% this week. Algorand also had an increase of coins on the market by 0,3%.
Crypto futures market
BTC and ETH futures were moving in opposite directions during the previous week. While BTC futures had a modest drop in value for all maturities, ETH futures gained significantly. BTC futures were traded by around 0,8% lower from the week before. Futures maturing in December this year closed the week at $121.215, and those maturing a year later were last traded at $128.345.
At the same time, ETH futures marked a surge in value of around 18% for all maturities. The coin passed the $3,5K levels. December 2025 futures were closed at $3.678, while those maturing in December 2026 were last traded at $3.958.
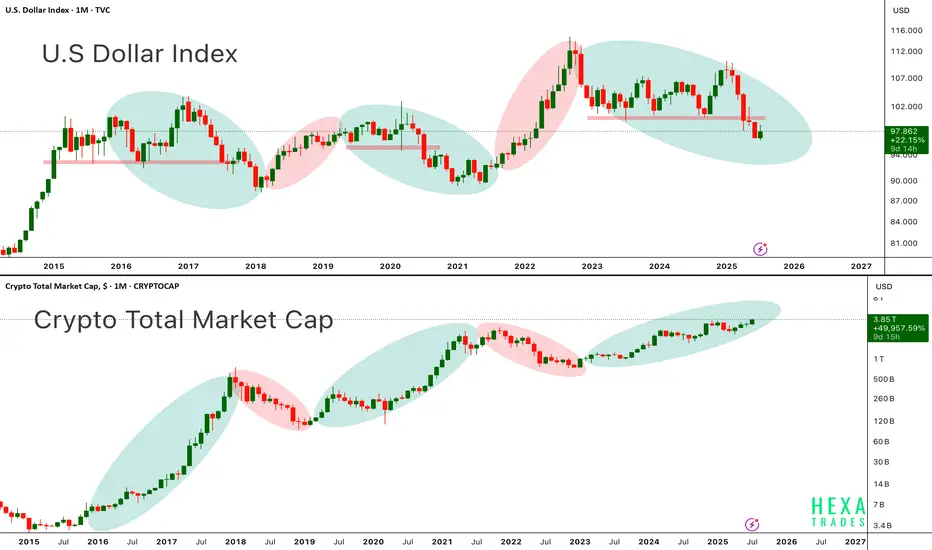
DXY vs. CryptoAbove chart highlights the long standing inverse correlation between the U.S. Dollar Index and the Crypto Total Market Cap a relationship that has guided the macro trend for Bitcoin and altcoins since 2015.
in the first chart, When the dollar weakens (green ovals), crypto tends to rally. When the dollar strengthens (red ovals), crypto markets usually experience corrections or prolonged bear markets.
In the second chart, each period of dollar weakness aligns almost perfectly with explosive crypto upside seen in 2017, 2020–2021, and now potentially again in late 2024 through 2025. Conversely, periods of DXY strength (2018, 2022) coincide with crypto market downturns.
Currently, DXY is entering a downward phase, while the crypto total market cap is pushing higher, now above $3.8 trillion suggesting that a new leg in the crypto bull cycle may be underway. Bitcoin and Ethereum have historically performed best when DXY trends lower, as liquidity shifts into risk-on assets.
Key Points:
-DXY and crypto market cap show a strong inverse macro relationship.
-DXY in a clear downtrend from 2024 highs supportive of further crypto upside.
-Crypto Total Market Cap approaching all-time highs suggesting broad market strength.
-Potential for BTC > $150K and ETH > $6K+ if this macro divergence continues.
-This setup resembles early 2020, right before the massive crypto bull run.
If the dollar continues to weaken structurally, crypto markets led by Bitcoin and Ethereum could see accelerated momentum, pushing into parabolic territory by late 2025.
Cheers
Hexa🧘♀️
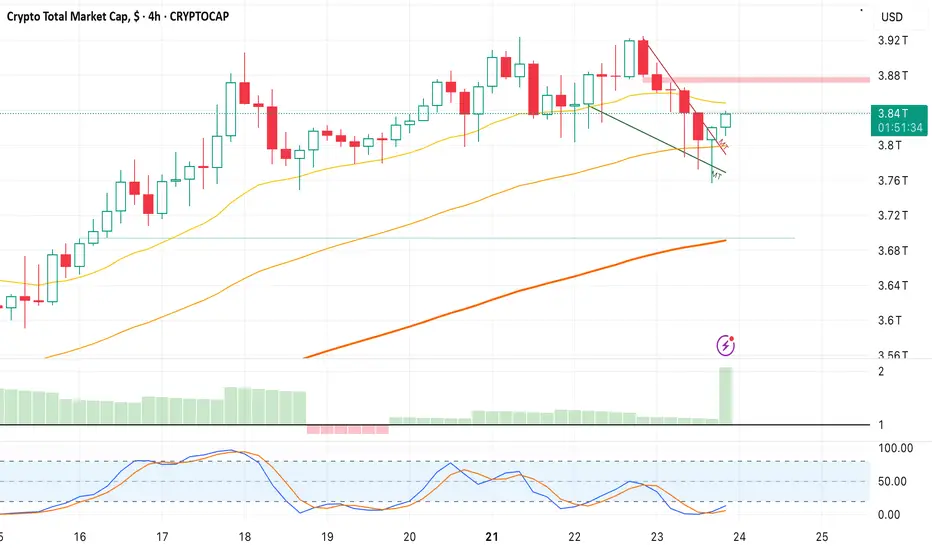
Bounce on Crypto Cap-Falling Wedge breakout at 3.836T, Target- 3.88 and 3.9.
-Looking for Bullish Crypto trading opportunities that align with this bias.
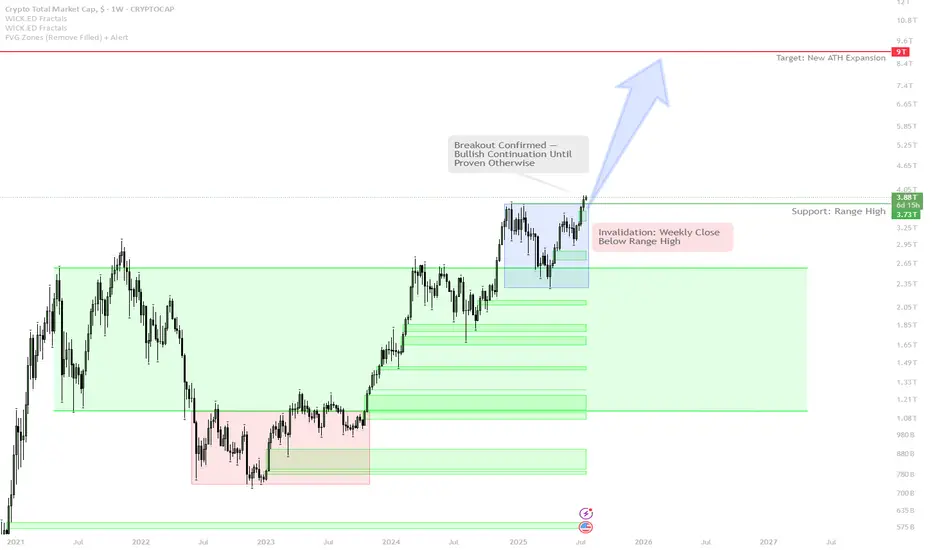
Total Crypto Market Cap: Weekly Breakout Signals Bull Run Contin
The weekly candle has closed above the key range high — this is a major bullish signal, similar to the breakout seen in early 2021.
As long as price remains above this breakout level, the scenario is a continuation uptrend — expect further expansion and strong price action.
If the market fails and closes back below the range high, the breakout will be invalidated — this would signal a potential range or pullback phase.
Current strategy is to trade with the trend:
Hold spot exposure and add on confirmed breakouts.
Do NOT short without a clear breakdown and structure reversal.
If a failed breakout occurs (weekly candle closes back below range high), take profit quickly and switch to risk-off mode.
Market psychology: Most buyers hesitate at lows, but FOMO after a strong move is classic. The disciplined approach is to buy the setup, not the hype.
This is a textbook technical breakout with historical precedence for explosive upside. As long as Total Market Cap holds above the range high, the path of least resistance is up. Attempting to fade the breakout is risky unless there is a clear weekly close back below the level. Trend continuation is favored until proven otherwise. The correct approach is to stay with the trend and manage risk only if a breakdown occurs.
Now We WaitTrading Fam,
In my last video, I mentioned how I had been learning to trade more patiently, giving myself those high-quality, high-probability winning trades. This is a perfect time to illustrate that strategy.
With our altcoin market overheated, I am expecting more rest, accumulation, and pullback in many of our alts. The selection of even decent entries is very slim. It's time for us to sit back, wait, and let the trades come to us again.
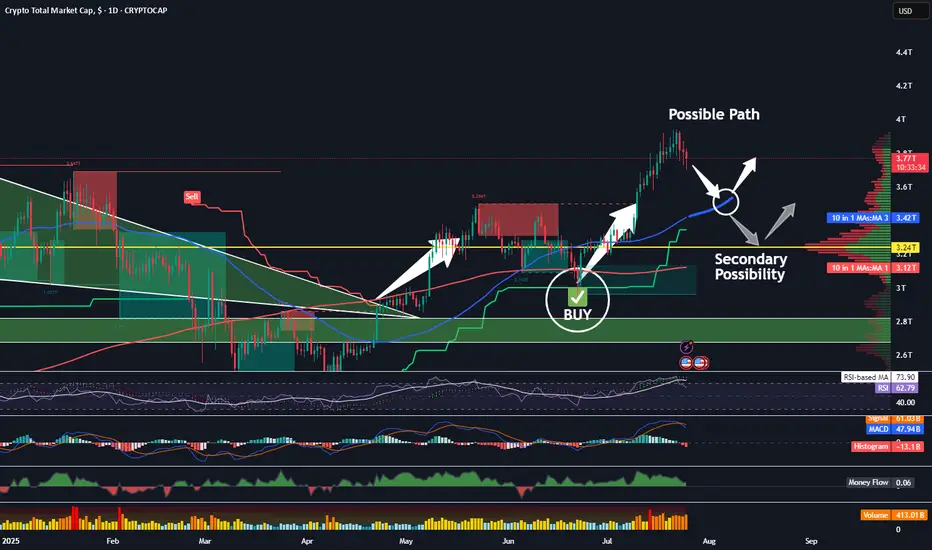
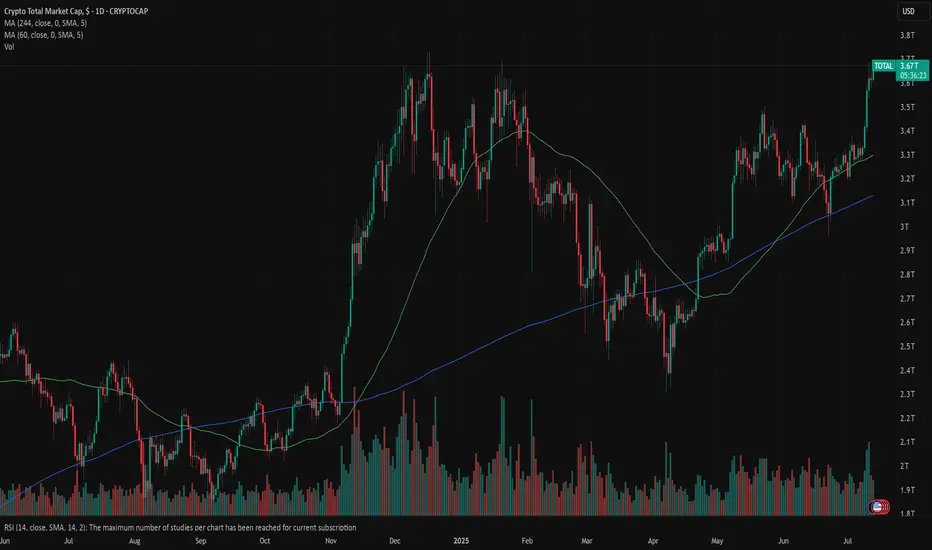
The TOTAL chart shows us more clearly what may occur. Let's discuss a few important indicators on this chart.
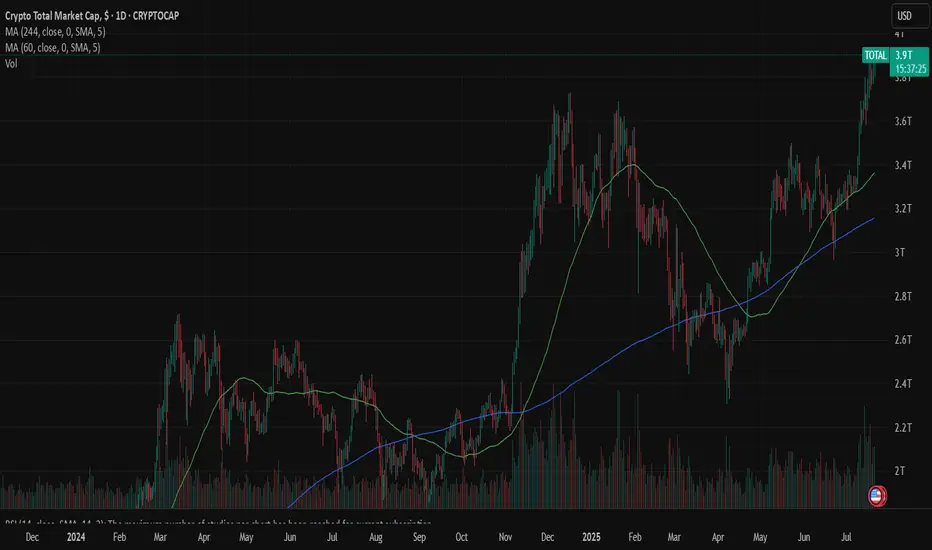
First of all, we see my indicator popped a BUY signal right around 3T. We had a safe bet at that point; we were going to see quite a bit of buying action in the altcoin space. Indeed, we did. The altcoin market increased by about 25 percent and went all the way to 4T, at which point the sellers came back in. Now, we are in the middle of a little bit of a pullback, and I think there could be more to come. I am expecting at least a touch of that rising 50-day SMA, currently at 3.4T.
Supporting my thesis here are the crossover of the RSI to the downside of its 14-day MA, the MACD cross, the Chalkin money flow decrease, and the HMV indicating high volume during these sell-offs. Leverage is being liquidated. This is healthy!
It is possible that the total market cap could drop even further, all the way down to that 3.24T PoC on the VRVP. That is where we see most of our volume in alts has occurred. Keep these two targets in mind. Once hit, I will begin looking for more trade entries once again.
✌️Stew
Crypto total market seems to be heading to $10 TConsidering the current market movements reaching $10T for total market can be achievable as the channel top.

Market Overview 📊 Market Overview
Today, most of the action came from the top 10 coins. If their momentum slows and profits are taken, capital could rotate toward other sectors—especially Others.d, which is currently testing key breakout levels.
🔸 BTC Dominance (BTC.D)
Dominance looks like it may pause or correct here.
👉 What to do? If you're in profitable alt positions, consider using a swing trailing stop to protect your gains.
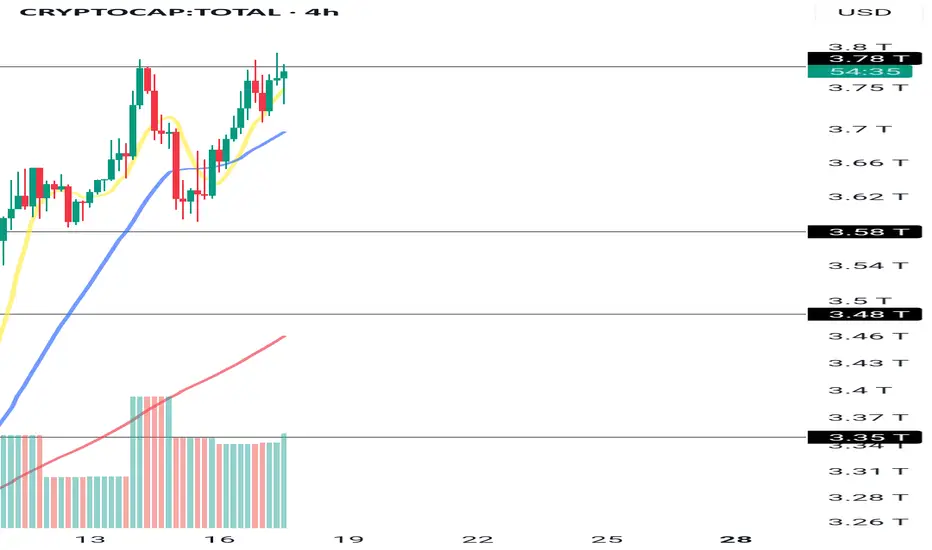
🔸 TOTAL (Entire Market Cap)
We're watching the 3.78 level closely. A breakout here would mean fresh money is flowing into the market. That’s what we need to keep this uptrend alive.
🔸 TOTAL2 (Altcoins excl. BTC)
Still looking bullish. The recent break and hold above 1.4 confirms bullish momentum and even offers a new entry trigger.
🔸 TOTAL3 (Top 10 excl. BTC & ETH)
The 982 level is our key trigger. As long as we stay above and maintain this clean bullish structure—like the last 4 candles showed—coins like TRX, ADA, and DOGE are showing great potential.
🔸 OTHERS.D (Coins ranked 10–100)
Stuck at 7.71. If top altcoins (TOTAL3 group) finish their local uptrend, funds may flow into this category next.
🔸 USDT Dominance (USDT.D)
Not much movement here. Capital is rotating out of BTC, SOL, etc.
✅ A break below 4.24 confirms continuation of the bullish market momentum.
🔸 BTC/USDT
To continue upward, we need to break 120 and 123.
Right now, many are in profit—which means profit-taking pressure might slow things down.
📉 If fresh capital enters and we break 120–123, new momentum could carry us higher.
⚠️ Entering here is risky. We might range between 115–120, which is actually good—it could build a solid base.
🚫 Even if we drop to 111, I’m not looking to short in this bullish market.
🔸 ETH/USDT
Strong uptrend continues, but no new entry trigger for now. If you're in profit, consider using a 1H swing trailing stop to lock in gains.
🔥 The market is shaping up beautifully across different sectors.
Thanks for reading!
💥 Tap the 🚀 icon if you found this helpful and don’t forget to share!
Total crypto MC - 1DThe total crypto market capitalization on the daily timeframe has formed a Falling Wedge pattern, which is typically a bullish reversal pattern. The price has broken out above the upper resistance line of the wedge, confirming the breakout. Currently, the price is undergoing a retest of the breakout level, which now acts as support. If this support holds successfully, it is expected that the market will experience an upward move in the near term, signaling potential bullish momentum.

Crypto Market Update – July 14th🔷Market Update – July 14th: Another Winning Move 🧠🔥
Another week, another breakout – and we’ve been tracking it every step of the way.
💸 Entries? Perfect.
✅ Targets? Hit.
🧠 Psychology? Nailed.
Today, we reached 122,795 , hitting a key target with precision. From there, we took partial profits — and are now watching the next leg toward 127K+ .
We’ve had 4 amazing entries lately, all executed with structure, risk control, and vision.
Today’s move? Just the latest in a series of well-calculated trades.
📉 Support now rests at 120,500 , with deeper support still valid around 114,921 .
This isn’t just a lucky guess — it’s the outcome of following levels, structure, and behavior.
But if you want to go deeper into what’s really happening beneath the surface ...
📊💸 Read the NEW Deep Dive Part III:
The Next BIG Whale Play Unfolds →
Inside it:
🐳 How the bear trap is being set
🧠 Why this is a disbelief rally
⚠️ Why shorting now = adding fuel to the fire
💥 And why this may be the first leg of a much bigger run...
Stay sharp. Stay structured. Stay ahead.
One Love,
The FXPROFESSOR 💙
Disclosure: I am happy to be part of the Trade Nation's Influencer program and receive a monthly fee for using their TradingView charts in my analysis. Awesome broker, where the trader really comes first! 🌟🤝📈
📊💸 And don’t miss Deep Dive Part III – The Next BIG Whale Play Unfolds:

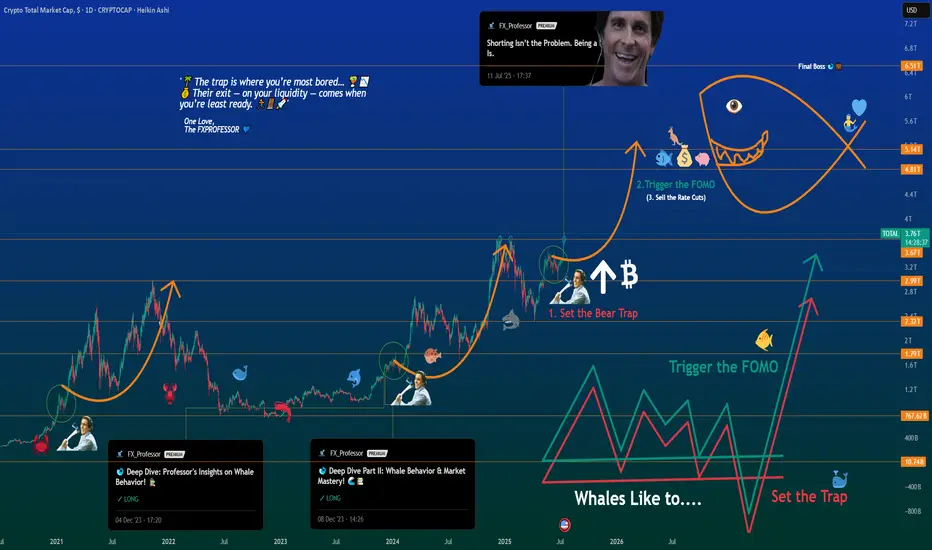
Deep Dive Part III – The Next BIG Whale Play UnfoldsDeep Dive Part III – The Next BIG Whale Play Unfolds
📍In Parts I & II of this Deep Dive, we broke down the psychology of whale behavior — from “Buy the Rumors, Sell the News” to the critical breakout zones that echoed historical patterns.
🐋 Back then, we spotted the whales' playbook early. The strategy was simple:
Buy the Rumors – Sell the News.
🧠 But now, the script has changed.
“The trap is where you’re most bored… 🌴📵
Their exit — on your liquidity — comes when you’re least ready. 💰🏄♂️💼”
Let’s break this moment down into what’s really unfolding.
We are officially entering the next stage of the cycle — not just in price, but in psychology.
This is no longer just about charts.
This is about human behavior on autopilot.
Here’s what I see happening right now — broken into three truths:
1️⃣ People Are On Holiday 🌞
From my community to the broader market, the energy is low.
People are either sunbathing on a beach or mentally checked out.
The focus is not there. The reflex to take action is dulled.
📉 The trap is where you’re most bored… 🌴📵
💰 Their exit — on your liquidity — comes when you’re least ready. 🏄♂️💼🚀
We’re seeing it unfold now:
1. Set the Bear Trap
2. Trigger the FOMO (will be down the road, yes)
3. Exit on Liquidity (the closing act of the play)
🕶️ But when everyone is away or asleep, that’s when the trap is laid.
It’s during these quiet, lazy days that the big moves get built.
2️⃣ This is a Disbelief Rally 🎢
The market trained everyone with a rhythm:
pump ➝ dump, pump ➝ dump, pump ➝ dump…
So what happens now?
People don’t trust the breakout. They’re frozen.
“We’ll dump again,” they say.
Except… what if this time, we don’t?
That disbelief becomes fuel.
It becomes hesitation — and hesitation becomes missed opportunity.
3️⃣ Bears Are Shorting Into Strength 🧨
This is key. While retail is confused, the bears are pressing in hard.
Their shorts are adding fuel to the pump they don’t see coming.
That’s why I posted recently:
“Shorting isn’t the problem. Being a psycho bear is.”
It’s not about being bullish or bearish —
It’s about timing , discipline , and narrative awareness .
Whales love this moment.
They lure in shorts, set the trap, then ignite the breakout straight into FOMO.
🧠 The Game:
Set the Trap → Trigger the FOMO → Exit on Liquidity 💥
This is what you’re seeing on the chart.
Not just price action — psychological choreography.
🕰️ In 2020–2021, we saw the exact same structure.
Part I warned about early accumulation and baiting behavior.
Part II showed how whales manipulated expectations with layered waves of doubt.
Now in Part III — the explosion few are ready for.
Zoom into the chart and it’s all there:
The curve, the trap, the trigger… and yes — the Final Boss.
🎯 The Final Boss: 6.51T
That’s the ultimate liquidity zone.
If this cycle plays out, we’re headed toward it.
“Sell the Rate Cuts” will be the new “Sell the News.”
It’s not the headlines that matter — it’s who’s left holding the bag.
🔚 Final Thought
The real exit — the one that traps most of retail — will come not when you’re euphoric,
but when you’re still saying:
“Surely we must dump now…”
So stay sharp.
Trade the chart — but don’t forget to read the behavior.
One Love,
The FXPROFESSOR 💙
Part1:
Part2:https://www.tradingview.com/chart/idea/VgMBPsp3/
The Bear Trap:
Disclosure: I am happy to be part of the Trade Nation's Influencer program and receive a monthly fee for using their TradingView charts in my analysis. Awesome broker, where the trader really comes first! 🌟🤝📈
MARKETS week ahead: July 13 – 19 | XBTFXLast week in the news
Previous week was short in US macro news, however, news regarding trade tariffs were the ones that shaped market sentiment at Friday's trading session. The optimism on the US equity markets still holds, regardless of a short correction on Friday. The S&P 500 reached another all time highest level, ending the week at 6.259. Gold was once again a refuge from tariffs for investors, gaining during the week, ending it at $3.354. Tariffs tensions rattled US Treasury yields, with the 10Y benchmark closing at 4,41%. Certainly, the winning asset of the week was BTC, which broke the $108K resistance and moved all the way up to $118K, bringing another all-time highest level.
This week was relatively quiet in terms of key U.S. macroeconomic data. The main highlight was the release of the FOMC meeting minutes from June. The minutes didn’t reveal any new information beyond what has already been communicated publicly. The Federal Reserve continues to emphasize the need for flexibility regarding future rate cuts and is likely to remain on hold until economic indicators more clearly signal a slowdown. Most analysts still expect the next rate cut to come in late 2025 and early 2026. This outlook is shaped by persistent risks of both rising inflation and increasing unemployment, driven by recently imposed trade tariffs, which present ongoing challenges for Fed policymakers.
When it comes to trade tariffs, the previous week brought news regarding imposition of a 35% tariff on imports from Canada and a 50% tariff on goods coming from Brazil into the U.S. There have also been discussions about the possible introduction of a broader 10% universal tariff on most other countries, with some mentions of rates as high as 15% or 20%, as well as 50% on all copper imports. News posted on Saturday noted the introduction of a 30% tariff on all imports from the European Union and Mexico. The European stocks closed the Friday's trading session lower, waiting for a tariffs-letter from the US Administration, which was released on Saturday.
News is reporting that the US Government managed to end June with a budget surplus of $27B, for the first time since 2017. The reason behind the increased funds analysts are noting a surge in income from tariffs, which reached $113B this year. Still, the broader fiscal picture remains challenging, as analysts are concluding.
Speaking at an event, Fed Governor Christopher Waller stated that the growing use of stablecoins could lead to faster and more affordable payments. "As a free-market capitalist economist, my goal is to see competition in the payments space lower costs for households, consumers, and businesses—plain and simple," he said. Waller also noted that while stablecoins might reduce the demand for physical U.S. currency, they could simultaneously strengthen overall demand for the U.S. dollar.
CRYPTO MARKET
This was a week for celebration for crypto enthusiasts. BTC not only reached the all time highest level, but this coin is on the road to $120K as it managed to reach level above the $118K. This was indeed another significant milestone for BTC to reach, while crypto enthusiasts are noting that the price could easily reach even higher values till the end of this year. What will be the case, is to be seen in the future. Total crypto market capitalization significantly gained during the week, ending the week total 10% higher from the week before, adding $330B of new funds. Daily trading volumes were more than doubled, with an average daily trading volume of around $300B. Total crypto market capitalization from the beginning of this year currently stands at 12%, with a total funds inflow of $380B.
The vast majority of crypto coins gained during the previous week, and managed to significantly increase their market capitalization. The most important coin which drove the market to the upside was BTC, with a surge in value of 8,6% on a weekly basis, adding a total amount of $185B to total crypto market capitalization. ETH also had an incredible week, surging, after a longer period of time, to levels above the $3K, adding 17,5% to its market cap with an inflow of $53B of funds. All major coins had a positive week. Solana was traded higher by 9,3%, adding $7B to its market cap. ADA ended the week higher by 22,6%, with an inflow of $4,6B. One of the unexpected significant gainers of the week was Stellar, with an incredible surge in value of 63,7%. DOGE gained 21%, Uniswap surged by 21%, Algorand was traded higher by 26%. Indeed one incredible week for all crypto coins with strong gains.
As on the spot market, there has also been higher activity when it comes to coins in circulation. It is not frequently seen that BTC has a weekly increase of circulating coins, as it was during the previous week, when the number of coins was increased by 0,1%. Stellar increased its value by an incredible 63,7%, but at the same time, it increased the number of coins on the market by 0,4% w/w. IOTA had a surge in coins on the market by 0,8%, while Filecoin added 0,4% of new coins on the market. Interestingly, this week, BNB decreased the number of circulating coins by 1,1%.
Crypto futures market
In line with the surge of the value of coins on the spot market, crypto futures also skyrocketed in value, reaching some of the all time highest values for long term maturities. BTC short term futures ended the week by more than 9% higher, while the longer term futures were up by more than 7%. Futures maturing in December this year reached the last price at $122.135. At the same time futures maturing in December 2026 reached the new all time highest level at $129.355. As per values of futures, the price of BTC has more space to reach higher grounds.
ETH futures also had an excellent week, surging by more than 20% for shorter maturities and above 16% for longer maturities. What is most important is that futures finally ended the week above the $3K levels. Futures maturing in December 2025 closed the week at $3.121 and those maturing a year later were last traded at $3.359.
$TOTAL CRYPTO MARKET CAP BREAKOUT CONFIRMEDWhat a FILTHY Weekly Close back within the POI 🚀
Bulls are back in biz, for at least the next few weeks.
I’m expecting a bit of sideways chop here, and the next leg up the first or second week of August.
This is in no way, shape or form a call for “ALT SEASON”, yet.
Still need to see what happens in the next few weeks,
BUT IT LOOKS PROMISING 🙏
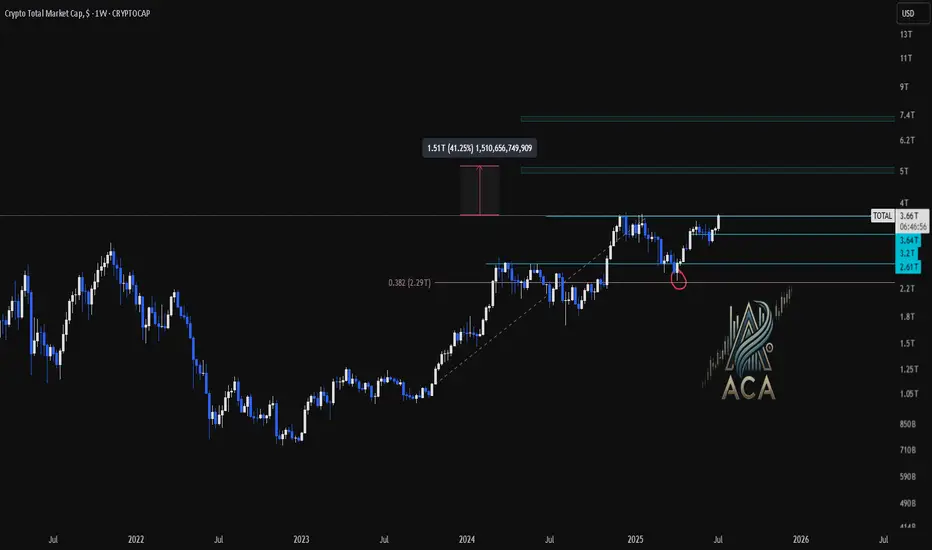
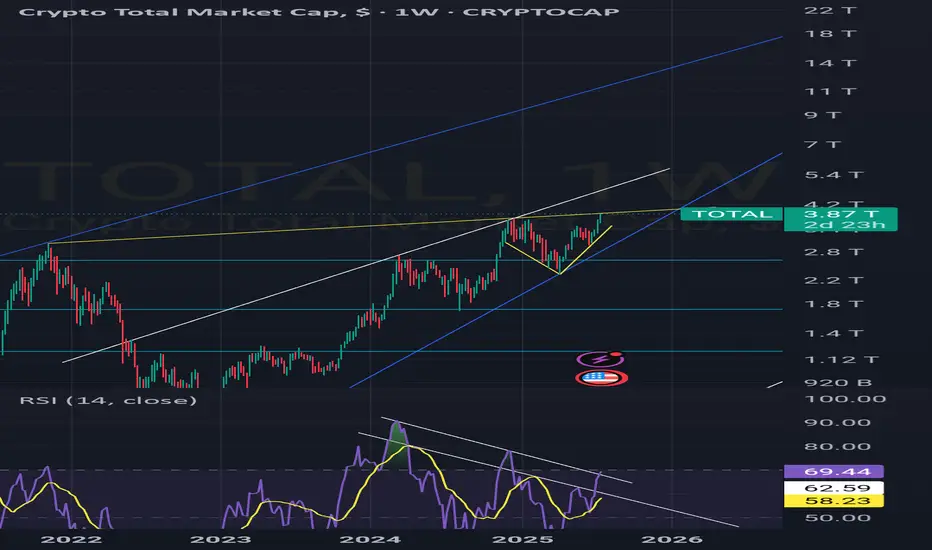
CRYPTO TOTAL MARKET CAP | Weekly Chart Analysis | Breakout in PrCRYPTO TOTAL MARKET CAP | Weekly Chart Analysis | Breakout in Progress
🔍 Let’s break down the crypto total market cap and highlight why the next move could be explosive.
⏳ Weekly Overview
The weekly chart shows a strong breakout above the consolidation box, following a classic fakeout to the downside. The 0.382 Fibonacci retracement level at $2.29T provided solid support, confirming the bullish structure and setting the stage for this move.
🔺 Bullish Scenario:
- The market faked out below the box, trapping bears, and is now breaking out above resistance.
- The breakout targets align with the Fibonacci extension, projecting a move toward the $5T region.
- This $5T target is not only a psychological level but also matches the next major Fibonacci confluence, adding further conviction to the bullish outlook.
📊 Key Highlights:
- 0.382 Fibonacci retracement ($2.29T) held as support during the fakeout.
- Breakout above the box signals renewed momentum and a shift in market sentiment.
- Upside target around $5T is supported by both the measured move and Fibonacci extensions.
- Previous resistance levels at $3.27T and $3.54T now act as support zones.
🚨 Conclusion:
Crypto is breaking out after a textbook fakeout and reclaim of the range. With confluence from Fibonacci targets and strong momentum, the $5T region is now firmly in play as the next major target. Watch for sustained closes above $3.54T to confirm the move and open the door for further upside
BackTest should be COMPLETEDLet's see what comes next , rally to new ATH ? maybe some other corections along the way , or another wick close to bottom to scare thenpaper hands ? 🤔
Total shows a big big ult partyTotal besides the Bitcoin and usdt dominance, indicates that we can have a huge ult season. The probability is 60%

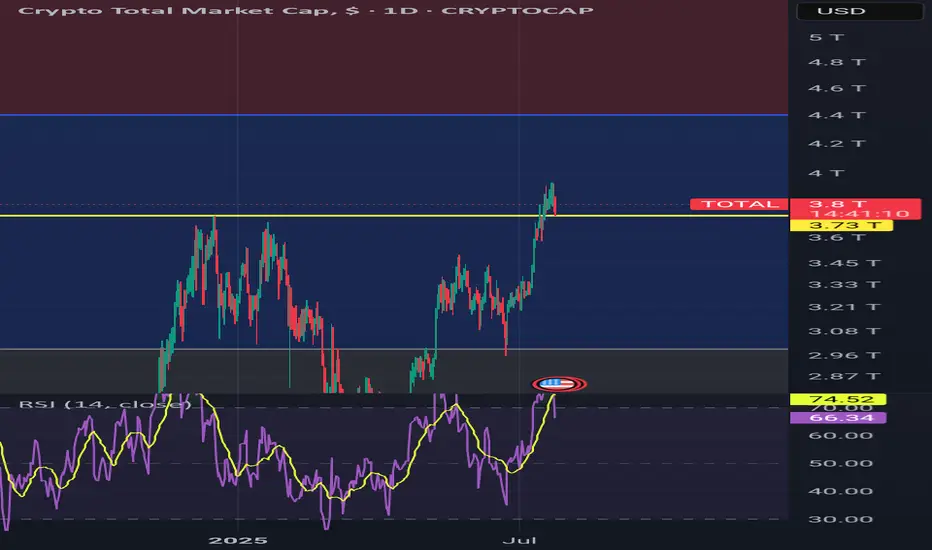
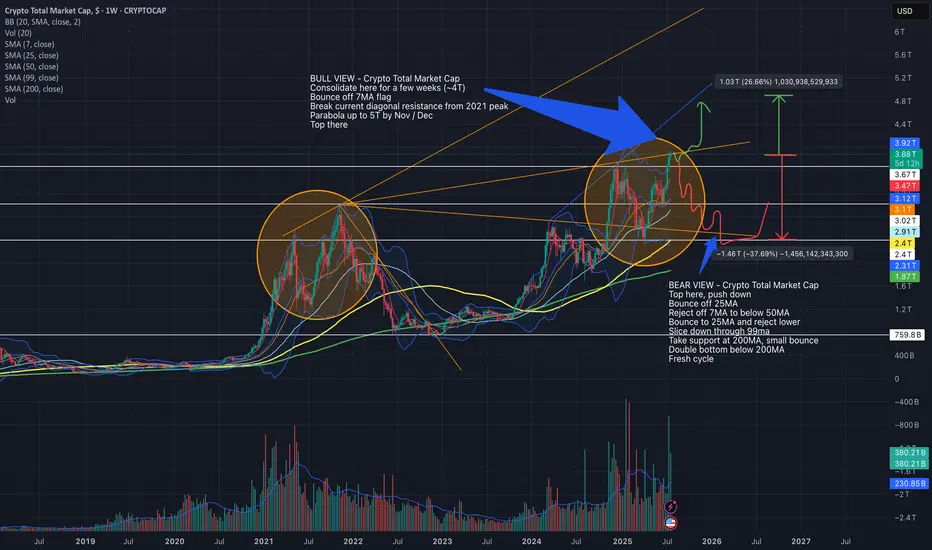
Bull and Bear Cases for Crypto Total Market Cap as of July 2025This chart outlines my views of where Total might go in the next few months - considering both Bull and Bear possibilities.
We are in a similar spot to 2021 peak at the moment, but still not as euphoric so it's a toss up as to which direction Total may move.
Current Total Market Cap - ~4T
Bull Case - Crypto Total Market Cap:
Consolidate here for a few weeks (~4T)
Bounce off 7MA flag
Break current diagonal resistance from 2021 peak
Parabola up to 5T by Nov / Dec
Top there
Bear Case - Crypto Total Market Cap:
Top here, push down
Bounce off 25MA
Reject off 7MA to below 50MA
Bounce to 25MA and reject lower
Slice down through 99ma
Take support at 200MA, small bounce
Double bottom below 200MA
Fresh cycle
These are just ideas. The future doesn't mimic the past but it does move in a mathematically sound manner. TA accuracy in forecasting can be affected by several real-world events, specially considering how volatile the world is at the moment.
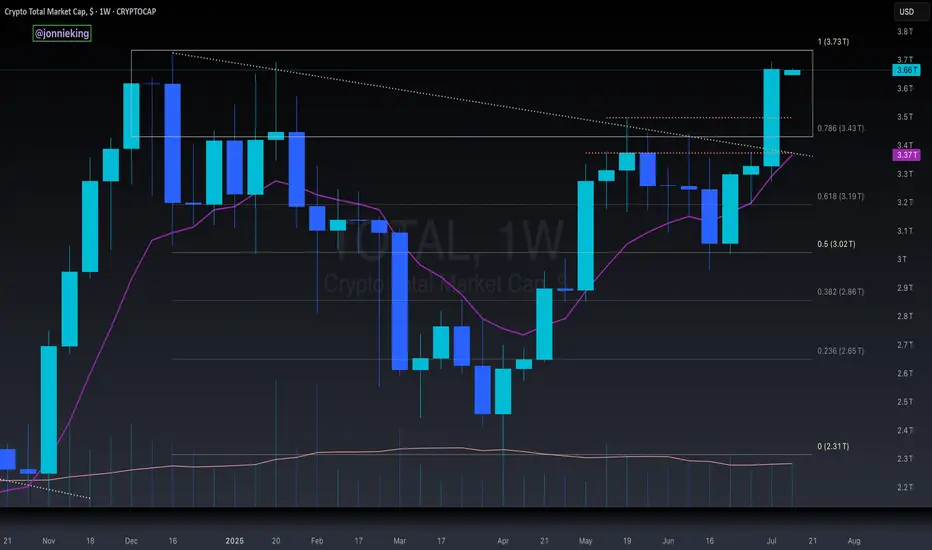
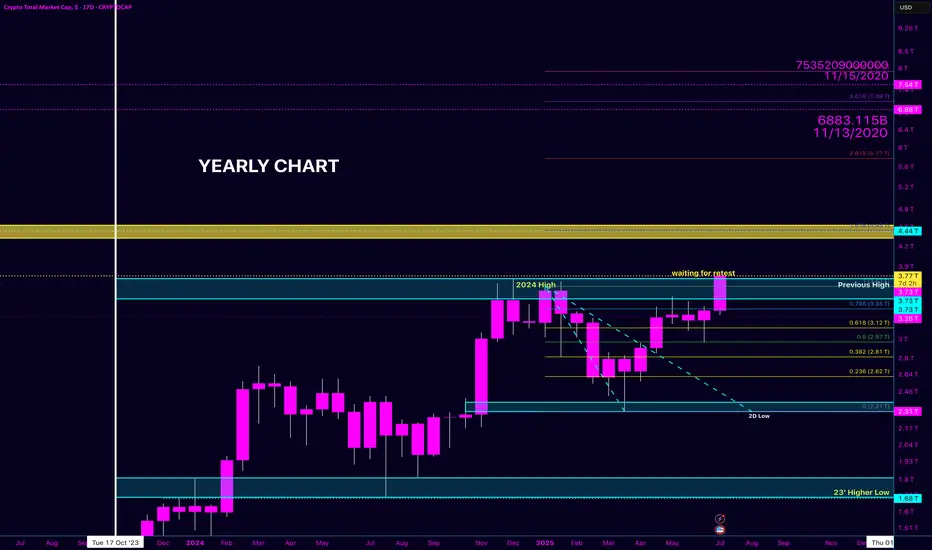
TOTAL Market Cap | Uncharted Territory AheadWe’ve officially tapped into the previous high zone that hasn’t been touched since 2017–2020 levels. This isn’t just another bullish candle — this is macro structure reawakening.
📊 Chart Context:
We’ve cleared the 2024 high.
Price has pushed into a long-standing resistance block, previously a ceiling during the last crypto cycle.
Now holding above key Fibonacci retracement levels (0.618 / 0.786) with conviction.
Momentum is building, and the market is waiting for the retest before liftoff.
📍 Key Levels to Watch:
Retest zone: ~$3.68T–$3.73T
Macro resistance: ~$4.44T
Above that? Uncharted waters. 🚨
🧠 Sentiment & Thesis:
The narrative is shifting.
Bitcoin dominance is stalling.
Altcoins, especially utility tokens like XRP, are showing signs of awakening.
If TOTAL holds above $3.7T on the retest, this could trigger a massive capital rotation across the board.
🔮 Big Picture:
This move could mark the beginning of a new supercycle. We’re no longer looking back — we’re staring directly at the void above. Volume, structure, and psychology all align for a potential parabolic leg.
Let the charts speak. The market remembers. And history doesn’t repeat — but it sure loves to rhyme.
totalTrading volume must be high to break through the historical ceiling. There is currently a divergence in volume and oscillator. If the resistance breaks, it will grow well, but for now, the probability of a fall is higher.