Analyzing Tokens with the Overall Crypto Market CapWhen analyzing individual tokens like XRP/USD, it’s crucial to consider the bigger picture—the overall crypto market cap. Market cap movements provide a bird's-eye view of the entire crypto ecosystem, acting as a barometer for where individual tokens may be headed. Here’s why using confluences between market cap charts and specific tokens is a powerful approach:
Market Structure Alignment:
The total crypto market cap gives a clear indication of the overall trend—whether we’re in a bullish cycle with higher highs or a consolidation phase. For example, as the market cap approaches key levels like $3.44T and targets $4.44T, this reinforces the bullish structure, supporting the idea that tokens like XRP will also push higher.
Key Levels and Targets:
Market cap charts help identify critical zones, such as liquidity areas, support/resistance, and Fibonacci retracement levels. These align with similar levels on token charts like XRP/USD. For instance, XRP’s retest of $2.90 aligns with market cap breaking into higher territory.
Momentum Validation:
Tokens rarely move independently of the broader market. If the market cap shows strong volume, sustained breakouts, or key retests, it validates token-specific moves. If XRP/USD is showing bullish momentum, but the market cap is stagnant or bearish, this could signal a divergence.
Confluence = Confidence:
By combining token-specific technical analysis (e.g., Fibonacci, trendlines, or order blocks) with macro-level analysis from the market cap, traders gain stronger confirmation for their trades. For example, XRP’s trajectory toward new highs is further supported when the total market cap follows a clear path upward.
Key Takeaways:
The crypto market cap is currently showing bullish structure, targeting $4.44T. This aligns with XRP’s path toward $2.90 and beyond.
Temporary pullbacks in the market cap or XRP are healthy for building support and creating stronger candles for higher breakouts.
Always zoom out—weekly and monthly time frames on the market cap chart provide clarity on long-term trends and help eliminate "noise."
Understanding the interplay between individual tokens and the broader market is essential for making educated trading decisions. Crypto isn’t just about isolated assets; it’s about the entire ecosystem working in harmony.
What’s your take on aligning market cap analysis with token trades? Drop your thoughts in the comments below!
TOTAL trade ideas

Possible Trend of CRYPTOthe detail is shown in the above Idea.
I made this Idea based on Candlestick Analysis and Harmonic pattern using Fibonacci tools in log mode.
Possible Trend of TOTAL
Possible Trend of TOTAL2
Possible Trend of BTC
Possible Trend of ETH
Good Luck

Total ChartAfter a huge cup and handle and breaking out and passing through 2 main resistances a pullback is expected, followed by continuing the uptrend.
DYOR
Goodluck

perfectly on schedule for this cycle.Total marketcap will reach 6.7-9 trillion on the fib extensions.
Sit back, relax and watch it unfold 👁️


what iftotal bounces off old channel total bounces off old channel total bounces off old channel total bounces off old channel total bounces off old channel total bounces off old channel total bounces off old channel total bounces off old channel total bounces off old channel total bounces off old channel total bounces off old channel total bounces off old channel total bounces off old channel total bounces off old channel total bounces off old channel total bounces off old channel total bounces off old channel total bounces off old channel total bounces off old channel total bounces off old channel total bounces off old channel total bounces off old channel total bounces off old channel total bounces off old channel total bounces off old channel

MARKETS week ahead: December 2 – 8Last week in the news
Regardless of a Thanksgiving Holiday in the US during the previous week, markets ended November with a positive sentiment. The US equity market ended its one of best months in the year, with the S & P 500 reaching its new all-time highest level at 6.040. Decreased geopolitical risks and strengthening of US Dollar, impact the price of gold to slow down a bit during the week, ending it around $2,670 level. In expectation of further Fed's rate cuts, the 10Y US Treasury yields dropped to the level of 4,17%. The crypto market remained with a positive post-election sentiment, where BTC tried for one more time to break the $100K level.
From the US macro perspective, there were two major events during the previous week, which impact market sentiment prior to Holidays. Fed's favorite inflation gauge was released, as well as FOMC Minutes from their November's meeting. The PCE data were in line with market expectations. The PCE price Index increased by 0,2% in November, reaching the yearly level of 2,3%. Core PCE remained smoothly elevated at the level of 0,3% for the month. At the same time, Personal Income was higher by 0,6% for the month, while Personal Spending was up by 0,4% for the month. The FOMC meeting minutes revealed conclusions of Feds members at their November meeting that if inflation continues further to slow down and if labour data continue to move in line with their expectations, this would be a solid case for further rate decrease. Current odds for 25 bps interest rate cuts stands at 66%, as per CME FedWatch Tool.
Another event that was closely watched by investors during the previous week is a shopping-holiday popularly called the Black Friday. First estimations showed that the spending of US customers climbed by 3,4% on a yearly basis. This year total e-commerce sales over the internet increased by an incredible 14,3% year-over-year, which shows a clear change of customer habits for incline purchase instead of shopping in stores.
Analysts from Morgan Stanley gave their projection of equities in China for the year 2025. As per their analysis, China can expect a relatively volatile equity market, with major threats mentioned “earnings pressure, geopolitical risks and potential tariffs”. At the same time, analysts see that exports will hold, due to competitive pricing, however, the housing market is expected to stay under pressure.
In an interview with CNBC, a VettaFi representative said that the next year belongs to small cap companies, in which sense, a small-cap index Russel 2000 could benefit the most. The environment of lower interest rates would be beneficial for further growth of these companies. Such sentiment started from November, where the index Russel 2000 gained 11%, and total 35% during the course of this year.
Crypto market cap
Although BTC was the star of the crypto market in the after-election period, still, the previous week belongs to altcoins, since now they are the ones to drive the total crypto market capitalization to the upside. Total crypto market capitalization increased by 2% on a weekly basis, where mostly altcoins managed to add some $70B. At the same time, daily trading volumes remained elevated, around $320B on a daily basis, modestly decreased from $412B traded two weeks ago. Total crypto market capitalization increase from the end of the previous year currently stands at $1.712B, which represents a 105% surge from the beginning of this year.
During the previous week BTC was on a net losing side, decreasing its market cap by modest $ 20B or 1% on a weekly basis. Another altcoin that was driving the market to the downside was market favourite Solana, with a drop in value of 6% or $7.4B. ETH and XRP were coins which gained the most in nominal terms. ETH managed to add $34.8B to its market cap, increasing it by 8.4%. XRP continues to drive market attention, with this week's surge of 28.7%, adding another $24.5B to its market cap. ADA was another altcoin with solid weekly performance, with an increase in its cap by $ 1B or almost 3%. THETA should be especially mentioned this week, as the coin gained 62% on a weekly basis, and was traded at the level of $3.11. Such an increase was rare to see previously with THETA. In relative terms, market attention was standing with Algorand, which increased its value by 53.3%, Filecoin was up by 32%, Uniswap was traded higher by 17%, while Maker gained 12% w/w.
Increased activity with circulating coins continues. This week Polygon was on a negative side, with a decrease of total coins on the market by 3.9%. On the opposite side was Filecoin, with an increase by 0.8%, IOTAs number of coins increased by 0.5%, while Stellar added 0.2% of new coins. Tether should be especially mentioned, as this week stablecoin increased its number of coins by 1.4%, same as its market capitalization.
Crypto futures market
As of the end of the previous week, the crypto futures market eased a bit for BTC, in line with the spot market developments. BTC futures were traded more than 2% lower for all maturities. During the week, futures maturing in December 2024 reached the level of $100K, however, they are ending the week at $98.540. However, futures from February 2025 are holding above $100K, where December 2025 closed the week at $107.120.
On the opposite side were ETH futures which were traded in green by more than 8% for all maturities. December 2024 ended the week at the level of $3.631, while those maturing a year later were last traded at $3.894. It is important to note that futures maturing in March 2026 are nearing toward the $ 4K level, while the closing price was $3.966.

Potential Correction for the Cryptocurrency Market CapAccording to the chart you're viewing, there is a resistance zone (3.36T to 3.26T) ahead. Considering the bullish momentum in the last three candles, there is a possibility of a breakout. However, if the cryptocurrency market cap is going to undergo a correction before reaching the top of the bullish channel, I think this zone is where the correction will occur.

$TOTAL market capLet's see what CRYPTOCAP:TOTAL chart has for us.
as a trader or investor you should know about the market condition before entering any kind of deal. TA is a way to predict the possible scenarios of a trend and can be combined with fundamental analysis for more accurate decision. in the charts we mainly focus on TA side and what's what i plan to do here.
Total market cap includes all assets in crypto market. this shows us how much this industry absorbs funds and adopts more individuals.
So far, this market/industry has been growing in long term and remained interesting for investors. A series of HHs and HLs confirms that idea. But there is a catch. i personally do not believe much in dynamic resistances or supports in trend lines but those lines might actually work as S/R sometimes.
As i see in CRYPTOCAP:TOTAL chart there was a bullish trend line that broke on Nov. 2022 and pushed the trend onto bearish side. although the trend kept printing HHs and HLs but loosing trend slop means weakness in long term trend and might caused by exhaustion. Bear in mind that more individuals involved in crypto market means less volatility and less changing range. i believe in next cycle we start seeing bull markets in smaller ranges with less X times growth.
-----------
Okay. trend moves above MAs and with current super green engulfing candle we just surpassed ATH at 3.01T dollars for a new ATH. Next month candle will open in next day so as always i will observe new candles behavior.
It is expected to see some corrections ( i don't expect major correction) and then bullish continuation. i see 3.8T $ as the firs fib. level barrier. the next one is 5.5T $. i expect this level as the cycle top. (might be wrong) but if volume surged more i will have to recheck the conditions.
------------
As always, These are my thoughts and can be wrong. Please DYOR before taking any financial decisions.

$TOTAL 1 year Crypto market capBased on various analyst predictions, the cryptocurrency market cap is expected to grow significantly by the end of 2025:
Bernstein analysts project the total crypto market cap to reach $7.5 trillion by 2025, up from $2.6 trillion currently1.
Crypto researcher Ether NasyonaL predicts the crypto market cap could reach $8 trillion by 2025, representing a nearly 400% increase from current levels3.
Standard Chartered Bank forecasts the digital asset market cap could increase fourfold to $10 trillion by the end of 2026, implying significant growth by 20254.
These projections are driven by factors such as:
Increased institutional adoption of cryptocurrencies1
Regulatory clarity and supportive policies4
Continued development of blockchain technology and DeFi applications
Growing mainstream acceptance of digital assets
While specific predictions vary, there is a general consensus among analysts that the crypto market cap is poised for substantial growth over the next few years, potentially reaching between $7.5 trillion to $10 trillion by the end of 2025 or early 2026.

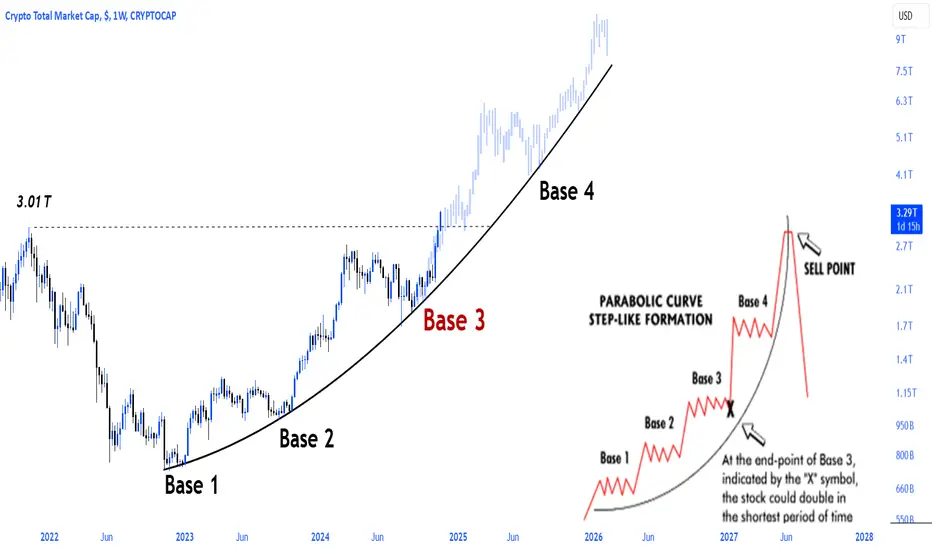
Total market cap is on fireCrypto Total market cap 2021 broke the ATH level (3.01T) and continues to move on the parabolic curve towards the highest levels in history
#Bircoin ⏩ #Ethereum ⏩ #Alts 📈

Crypto Total Market Cap | Chart & Forecast SummaryKey Indicators On Trade Set Up In General
1. Push Set Up
2. Range Set up
3. Break & Retest Set Up
Notes On Session
# Crypto Total Market Cap
- Entry Bias Hypothesis | Double Formation
* Retracement & Flag Structure | 50
- Resistance Area At 3.35
* Retracement 1 & 2 | Uptrend Bias
Active Sessions On Relevant Range & Elemented Probabilities;
London(Upwards) - NYC(Downwards)
Conclusion | Trade Plan Execution & Risk Management On Demand;
Overall Consensus | Buy

We're not going down, we're going up nowI'm 100 percent sure we'll go up. For the sake of fashion, I also placed a stop loss, but it is completely pointless at the moment.
Notice the pink bows
Good luck my friends and see you at the top
I'm not swayed by your downtrend opinion

Market Analysis: CONFIRMING The Bull Run Continues
Market Analysis: CONFIRMING The Bull Run Continues!!
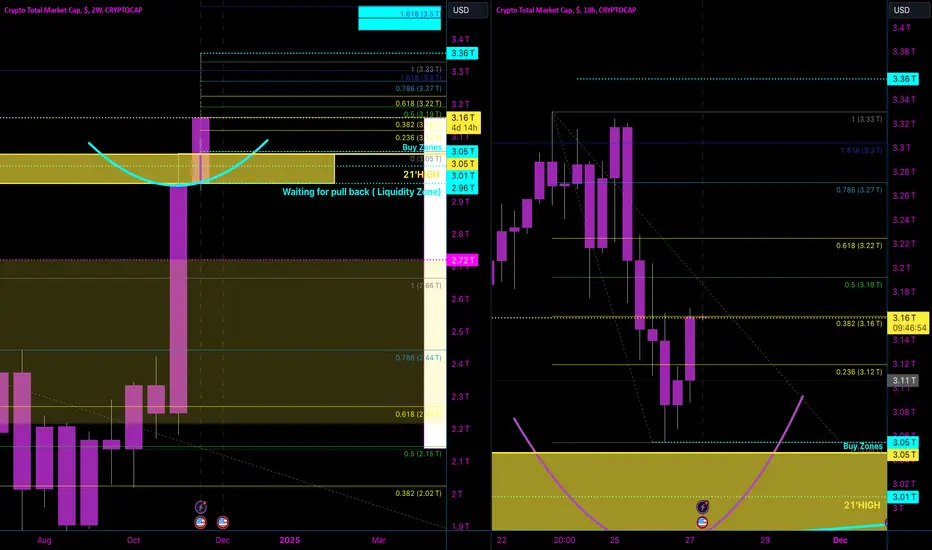
After thorough analysis, I’ve been reviewing the lower timeframes and identified a W formation (double bottom) on the 4-hour chart, which has been confirmed by a deeper look into the 10-hour chart. This consistency across timeframes strongly indicates that structure is solid and the bottom for the current candle has been established.
What This Means:
• Re-Test of 3.36 Trillion: Based on current market behavior, I firmly believe we are gearing up for a re-test of 3.36 trillion in the total crypto market cap. This is a critical level, and breaking above it would likely lead to a new higher high.
• Bullish Confirmation: Both the W formation on lower timeframes and the liquidity zones identified on higher timeframes (like the 2-week chart) signify a healthy bullish structure. This suggests the bull run is far from over.
Key Observations:
1. Lower Timeframe Insights:
• Switching to the 4-hour chart revealed the W formation, signaling a double bottom and potential reversal.
• The 10-hour chart confirmed this structure, showing that the pullback has been retested and validated.
2. Higher Timeframe Confirmation:
• The 2-week chart highlights the importance of liquidity zones where support builds.
• Price consistently pulls back into these zones to gather momentum before pushing higher.
3. Line Chart Comparison:
• Using a line chart, I demonstrated the difference between an M pattern (triple top) and a W pattern (double bottom).
• The W pattern aligns with the current bullish momentum, while the M pattern signals a bearish pullback.
My Prediction:
Today, November 27 2024 , I confidently predict that we are entering the next phase of this bull run. The crypto market cap will:
1. Re-test 3.36 trillion, either today, tomorrow, or later this week.
2. Push past that level, forming a new higher high and continuing the bullish trend.
Why This Matters:
• Healthy Candle Structure: Each candle, especially on higher timeframes, is being built with layers of support, ensuring stability for the next bullish move.
• Bullish Sentiment: The pullbacks we’re seeing are part of a natural cycle to build momentum for the next leg up.
• Get Ready: With the structure in place and confirmation across timeframes, the market is setting up for significant moves. It’s about to get crazy.
Final Note:
This analysis highlights the importance of using multi-timeframe analysis to understand market structure. By focusing on higher timeframes for clarity and lower timeframes for precision, you can better anticipate market movements and trade with confidence. The bull run isn’t over—stay prepared for what’s to come.
TOTAL CRYPTO MARKETCAP PREDICTIONjust put a record & prediction. currently it showing a big bull flag and already breakout. lets see where it goes

Total marketcap Total hit the 1.61 fib retracement . I expect a small correction in the coming days . because buyers are getting exhausted seems to me as the momentum is slowing down . most of the coins are on the green since November 4th so it’s healthy for the market to pull back for better buying opportunity .

MARKETS week ahead: November 25 – December 1Last week in the news
The crypto and gold markets were in the spotlight of the markets during the previous week, considering that there has not been much significant US macro data posted. Investors' positive sentiment for BTC continues to hold, where BTC reached levels quite close to the $100K mark. Despite US strengthening, the price of gold returned to the levels above the $2,7K considering ongoing geopolitical risks. The US Treasury yields are waging current macro data, searching for a clue whether the Fed will skip rate cut in December. The 10Y benchmark yields modestly eased till the level of 4,4%. The US equities were also traded with a positive sentiment, but the investor attention is currently switched from tech giants toward the industrials and consumer sectors. The S&P 500 ended the week at the level of 5.969.
The news that spotted the most market attention during the previous week is that SEC Chair Gensler will step down from his current position on January 20th. In an official statement by the SEC, Gensler noted that during his mandate “the SEC has met our mission and enforced the law without fear or favor”. The crypto market reacted positively to this announcement. On the other hand, news from Saturday is that a new US President elected Donald Trump nominated Scott Bessent as a new Treasury Secretary in his administration. As a reasoning, Trump commented on Bassent as “one of the world's foremost international investors and geopolitical and economic strategists”.
The latest BTC rally toward the $100K certainly spotted market attention. However, there is an emerging number of analysts who are pointing toward the risks of investments in the crypto market, as they are pointing out that some investors might be confused by treating BTC in the same manner as gold. State Street Global Advisors are the latest to point to this distinction, pointing out that BTC does not offer stability as gold, calling the crypto narrative “manipulative”.
Tesla shares continue to gain, as well as the wealth of Elon Musk. Reuters reported that the US judge rejected the request from the US SEC to sanction Elon Musk for not appearing at the court-order testimony related to regulators probe over his takeover of Twitter.
A so-called Black Friday, a holiday shopping season is nearing, so investors used the previous week to open positions with companies in the retail sector. As the consumer sector showed signs of strength, the retailers revised their earnings forecasts for the end of this year. Analysts are certain that this year Black Friday might provide the real picture of actual strength of consumer spending in the US.
Crypto market cap
An interest in the crypto continues to hold investors on the market. A new record was reached during the previous week, where the total crypto market passed the value of $3 trillion for the first time in the history of this market. Actual value of the market as of the weekend stands at $3.28 trillion which represents an increase of 10% on a weekly basis, where there has been added a fresh new $285B to its value. Daily trading volumes also reached new historically highest values with a turnover of around $412B on a daily basis, which is a surge from $351B traded a week before. Total crypto market capitalization increase from the end of the previous year currently stands at $1.642B, which represents a 100% surge from the beginning of this year.
During the previous week all coins gained in value, with some significant fund inflows in both major coins but also in other altcoins. BTC led the market with a surge in value of 7.7% on a weekly basis, adding a new $138B to its market cap. ETH followed the path, with an increase of 8.6% w/w in value or $32.8B. XRP continues to gain market attention since last week, with an increase from this week of 28% or $18.6B. ADA is among significant gainers, with a weekly gain in value of 39.8% or $10.6B. Market favourite Solana surged by 19.4% or $19.8B. During the previous week the absolute weekly winner was XRP, however, this week Stellar surged by an incredible 142.8% on a weekly basis, which was the highest weekly gain for this coin ever. Incredible weekly returns go on, where coins gained somewhere from 8% up to 20% or 30%.
There has also been increased activity when circulating coins are in question. First, Tether should be mentioned, as this stablecoin added 3.7% of new coins on the market, increasing by this number its total market cap. This week Solana added 0.6% of new coins to the market, while Filecoin and Maker number of coins surged by 0.4%.
Crypto futures market
Increased optimism from the spot market was evident also on the crypto futures market. Both BTC and ETH futures continued to gain for all maturities. Some new ATHs are evident with BTC long term futures.
BTC futures were traded by 8.5% on average higher. December 2024 ended the week at the level of $100.815, which is the first time that this maturity passed the level of $100K. At the same time futures maturing in December 2025 also reached their historically highest levels at $109.570. This is quite a positive sign for BTC over market expectations in the future period.
This week ETH futures also gained considerably, around 7% on average for all maturities. December 2024 ended the week at the level of $3.364, while futures maturing in December 2025 closed the week at $3.585. On a positive side for ETH is that all maturities managed to pass the $3K psychological level.

Comparing Total 1,2,3 in weekly chart.(A comment for investors).Hello everyone
In my suggestion, this is the most critical chart idea I have ever posted and I recommend you to save it for the future.
I do not care about numbers in this chart and I just tried to show you what might happen as simple as I can (not to get understandable mark) and I recommend you to exit the market after second rise.
Remember: Do not care about how high will be these trends, and just get out the market after second rally (might be nest year).
I will tell you when get in again, if we are together yet.
Thanks

The largest market cap in #Crypto history is being uploaded!#TotalMarketCap continues its parabolic run, leaving behind the critical level of 3.01 trillion dollars, which is the 2021 ATH!
SEND #Alts #Ethereum #Bitcoin 🧲
Total CryptoTotal Crypto!
Potentials for that are very high.
BUT(!) - watch Indicator - becomes overbought. So expect pullback in near future!

US ELECTION DAY The day is finally here. The world is watching but most importantly the crypto market is watching too. Trump still leads the Polymarket forecast and IMO opinion that would lead into the next phase of the Bullrun, breaking out of the 8 month downtrend and complete the bullflag continuation pattern.
If the Democrats win I could see a delay in proceedings, a flush toward the range midpoint after panic before regaining some form of stability going into Q1 2025. In the past no matter who has run America BTC does still see progress, I do think that progress will come quicker with a Republican victory.
I'm expecting volatility as always in such a big news release, a release that will overshadow what is normally the most important data release with the FOMC that takes place 2 days away. I would think that this time around it will be less important and a 25bps cut is near enough confirmed anyway.
Good luck out there fellow traders!

Total marketcap will reach 10T in may-october 2025As you can see we are early bull reaching and passing 3T, we already doing ATH in total market-cap, if we follow the Fibonacci sequence we potentially could reach 10T and ATH cycle but the mid 2025, we also see the cycle keeps accelerating as each year we see the ATH more fast after halving, also kkep in mid to reach 10T we could potencially see 25-33% downfalls to reach a market balance, also we could potentialy see a short a last short squeeze before 2025, in last week of december the alt season will EXPLOTE!!!!

$TOTAL totally streched to upside; up or down?TOTAL is totally streched to upside; it is not only derivating but is also on a dangerous wedge, signaling a very possible drop (purple arrow down), at least to touch:
1- an important Fibonacci Circle (marked on red)
2- the support of TOTAL all-times-high (horizontal blue dotted line)
3- old May 2021 support of TOTAL all-times-high (horizontal pink dotted line)
4- ceiling of ghost channel from the last few months of downtrend (yellow channel)
5- volume weighted support line (black line)
6- possible touch on 200 EMA (green strong line)
You can see also that first pannel is about to show a crossing of RSI lines
Second pannel shows a red dot sell signal on Detonator B
Third pannel shows also a crossing down on Detonator C
MACD is losing strengh
We don´t know yet if the market still has bullets to go to the upside, showed by the thin purple arrow, but it is a possibility, as target coincides with very important (years back) trend line of resistence
