📈 The Cryptocurrency Market | Growth OpportunityThe Cryptocurrency market has been seeing some choppy action, we can see some weakness, many shakeouts, corrections and retraces... We focus mainly on the Altcoins.
As a new bullish wave is approaching the market, this is a great time for a friendly reminder; Retraces and corrections are nothing more than a great opportunity to buy-in, rebuy and reload.
✔️ Right now things might look bad because Bitcoin has been dropping for almost two months.
✔️ Right now things might feel down because many Altcoins hit new lows...
The thinking will be completely different in the coming months. When looking back, you won't be feeling and thinking that things were bad in these days, you will be thinking that we had such great prices and somehow you missed the train.
It is hard to be a contrarian at the right time.
It is hard to buy red.
But to sell green you need to buy red.
To have a great entry prices must be low, if you wait for hype to buy, you might end up buying at the top.
While there can be some waiting now it can never be longer than buying at the top of a bullish wave. If you buy at the bottom or near support, you can simply wait. If there is a delay, think long-term.
If you buy at the top, even if you wait long-term you will give up at the bottom and when you sell everything goes up.
✔️ What I am trying to say is that the best time to buy is when prices are low and near support.
The best time to sell is when prices are going up.
Bitcoin is not going up now, so we have a buy opportunity right in front of us.
This is not financial advice.
Make sure to do your own research because when trading, buying/selling any asset, there is always risk involved. We are not responsible for your action.
If this information does not resonate, you can just ignore it and move on.
If you find this information useful, feel free to boost, comment and follow!
Thanks a lot for your amazing support throughout the years.
We are here for the long-term. The market moves in waves; up and down, up and down... It's been down, soon it will be up.
Namaste.
TOTAL trade ideas

MARKETS week ahead: September 11 – 17Last week in the news
Another losing week on the equity markets and another flat one on the crypto market. This week was marked by surging commodities prices, which left its mark on the market sentiment. The further inflation fears are again active, as Saudi Arabia announced oil production cuts, while gas prices surged by 10% in the EU due to union strike in the largest gas production facility in Australia. SPX is ending the week below 4.500 level, BTC continues to hold above 25K support line, while ETH manages to stay above $1.6K.
The previous week put commodities back to the spotlight of the markets. Namely, it started with an announcement of Saudi Arabia that the country will extend its 1 million barrel daily voluntary oil production cut. Decrease in production will last at least till the end of this year, and will be reviewed on a monthly basis. Few other OPEC nations will also join Saudi Arabia with their cuts in production till the end of this year, which is a silent agreement outside the OPEC+ agreement. Highest Brent crude oil price reached was $90/barrel after the news was announced. Such a news was also perceived negatively across markets, considering that it puts into jeopardize efforts of western countries officials to fight inflation. Further increase in oil prices might imply higher inflation and probably more rate increases in the future.
At the same time with the surge of the oil prices on the markets, came the news that gas prices in the EU jumped by 10% due to the strike in the major LNG facilities in Australia. The unions are currently in negotiations with the US energy company Chevron over jobs and salary conditions. It is expected for decreased gas production to be prolonged during the week until the agreement is made between the company and the work union. The EU economy is struggling with both inflation and decreased economic output, in which sense, increased gas prices during the winter period might further hurt the EU economy.
In light of the dozens of filings with SEC for the first spot BTC ETF, during the previous week ARK Invest and the crypto investment firm 21Shares filed for the SEC`s approval for the first spot ETH exchange traded fund. This filing counts among the first ones with the aim to invest in ETH instead of BTC. Although SEC recently postponed its decision on BTC ETF`s for October this year, the decision of Ark Investment to file for ETH ETF was supported by the Grayscale`s win of a lawsuit against SEC after SEC refused to provide green light to Grayscale for a conversion of its Bitcoin Trust into an ETF.
Reuters is reporting that HongKong digital asset financial services firm HashKey Capital will invest $100 million of its funds into altcoins. BTC will take less than half of these funds, while ETH and two other altcoins will take the rest of the funds. A decision was also supported by Hong Kong`s clear regulation on digital assets, putting it as a world`s leading crypto hub.
Crypto market cap
Previous week was the one with commodities in focus, while other market events were more or less put aside. The increasing oil prices caused by Saudi Arabia's announcement of continuation in decreased oil output at least till the end of this year, impacted the oil prices to go as high as $90/barrel. This news was not well perceived by financial markets as expectations on further increase in inflation emerged. If the oil market does not calm down in the coming period, it might imply further rate increases by central banks in order to fight inflation. Regardless of developments on the oil market, and investors’ concerns, the crypto market slowed down further during the previous week, losing modest 1% on a weekly basis or $7B in nominal value. Currently this market is set to react to any news related to SEC`s moves on BTC and ETH ETF`s applications which might impact further flat moves in the coming period. Daily trading volumes reached their lowest levels since December last year, moving around $28B on a daily basis. This is also a significant drop from $60B traded during the week before. Total crypto market capitalization increase since the beginning of this year currently stands at level of 35%, where it has added total $267B to the market cap.
During the previous week the crypto market was performing in a mixed manner. Major coins were on a losing track, while several altcoins performed relatively good on a weekly basis. BTC lost $3.2B in market value or 0.65%, while ETH was down by 1% with a loss of $2B in its market cap. XRP was another coin with a drop in value of 3.5% or almost $1B. In a relative terms, other altcoins which finished the week in red were ADA with a drop in value of almost 2%, Litecoin was down by almost 3%, Polkadot decreased its value by 5%, while Uniswap was down by 5.3%. On the opposite side were several altcoins with relatively good performance, like Maker, which was up by around 10%, Miota was winner of the week with an increase in value by 19.5%, OMG surged by 6.6% , while LINK and Dash were up by more than 3%. It seems that some funds flows occurred from major coins toward the several altcoins during the previous week. There has been some increased activity when it comes to the coins in circulation. For the first time in many months, BTC has increased its circulating coins by 0.1% w/w. Solana and Filecoin had an increase in coins in circulation by 0.7% both, while Monero managed to add even 3.3% to its total circulating coins. Such activity in new coins on the market has not been recently seen, especially taking into account significantly decreased daily trading volumes on the crypto market.
Crypto futures market
The crypto futures continued their downtrend for the third week in a row. Both BTC and ETH futures finished third week in red on the CME. BTC short term futures were trading around 1.5% lower from the week before, while the long term ones were down by 0.7% on average. Futures maturing in December this year were last traded down by 2.13% w/w ending the week at price of $26.420, while those maturing in December next year were traded down by 0.7% and closed the week at price $28.940. This was a drop from the $ 29K level, traded during the week before.
ETH futures performed in a similar manner. Short term futures were down by 1.6% on average, while long term ones were down by almost 1% on a weekly basis. December 2023 was down by 1.7% and ended the week at price $1.665, while December 2024 was down by 0.95% with a closing price of $1.776. This was a further decrease from the $1.8K level for ETH. At this moment expectations of the market for both BTC and ETH are not positive.

Continuation of the bear market in cryptoJudging by the latest news and the technical picture in general, the bear market will continue for at least another year or two. Right now we are in the middle of a flat bear market and with a high degree of probability we will reach the level of 700-800B by the end of this year. Ethereum should retest the level of $900-1000, but Bitcoin may not go much below $20,000, because it looks much stronger than all other altcoins.

CRYPTO TOTAL MARKET CAPThis would be a prolongued catastrophic draining and patientce/willpower to live outcomes be.
Slow grind of a 3 wave move just to have a nother sharp drop in 3 waves to kill the current lows and run all the stops, create blood on the streets and to make people say that the crypto is dead AGAIN....
One of the potential counts...

Crypto Total Market Cap BreakdownWith Bitcoin & Ethereum breaking down, it's no surprise to see total market cap doing the same. A rejection at key overhead resistance is never good. Being below the 3-year ma and Ichimoku Cloud is never good either. The path of least resistance is currently to the downside. There simply isn't enough weight of evidence to turn bullish at this point. I know there are a ton of fundamental reasons to be bullish. An unbiased analysis of the chart evidence tells us a different story though. Be careful out there.

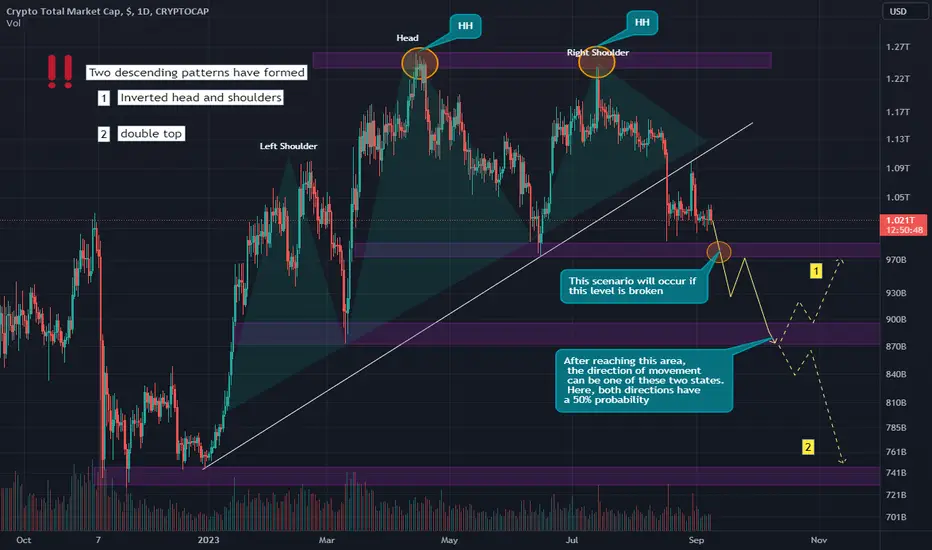
total cryptoTotal has faced a heavy fall and will fall in the near future. Everything is clear in the picture. It has formed two negative patterns, both of which are very strong patterns
#TOTAL MARKET CAP ANALYSISThe Total market cap is moving in a symmetrical triangle. Volume is very low in the market. MACD is in the neutral zone.
The Ichimoku cloud is acting as resistance. We've to keep an eye on a solid breakout or breakdown of the triangle for short-term direction confirmation.

Crypto Total Market Cap: $874BThe crypto total market cap is on the edge of fall.
Let's see where it goes.

Total could drop hard if it breaks 1T
After retesting the recent high in the 1.2T zone during mid-summer, the Total Crypto Market cap has begun to decline and has dropped to the 1T zone support level. The rise on August 23rd was, in fact, only a spike, and the bulls were unable to sustain their gains. Now, we find ourselves once again near the support level.
Considering the inability to achieve a new high in the summer and the subsequent drop to this horizontal support, I'm feeling very pessimistic about the future. If we break below this support, it will expose the next level at 870, but to be honest, I'm more focused on the possibility of a test of the 750 low.

MARKETS week ahead: September 4 – 10Last week in the news
Equity markets started September in a positive territory, erasing some of the losses incurred during the previous month. Treasury yields slowed down on reported US unemployment figures, while the crypto market was supported by the Grayscale`s lawsuit win against SEC`s after the regulator denied its application for BTC ETF. Bitcoin is ending the week close to $26K, while ETH manages to hold above $1.6K.
The crypto market has been supported during the previous week with the news that the US Court of Appeals ruled in favor of Grayscale in its lawsuit against the US Securities and Exchange Commission, after the SEC has denied Grayscale`s application for conversion of company`s Bitcoin Trust into an Exchange Traded Fund. Such a decision is important in a manner that it might support other companies which have filed with SEC for the first BTC ETF, to gain approval. This is at least per market expectations. However, the last word is with the SEC, so it might be too early for higher optimism. As the news was published, BTC surged by more than 7%, while other major coins also gained in value.
The US Securities and Exchange Commission delayed to issue a response to all applicants for spot BTC ETF`s, including BlackRock, WisdomTree, VanEck, Valkyrie Digital Assets and others. As per information provided, such a decision could be expected to be brought up in October this year. One of the rationales for such a decision is expectations to have adequate public feedback on applications. Bitcoin dropped more than 4% on this news.
The US banks continue to struggle with regulation, opting for their survival of current unfavorable economic conditions. In their latest call to regional banks, the US regulators unveiled plans by which regional banks, with at least $100 billion in assets, will be forced to increase their capital through debt issuance in order to strengthen their position. The aim of such a decision is to protect depositors in case of some further difficulties faced by banks in the US. Analysts perceive such a government move as a negative, considering that it is going to increase costs of conducting business for banks, which are already struggling to sustain their profitability and capital levels.
Paolo Gentiloni, the European Commissioner for economic affairs, requested CNBC journalists not to call the current state of the EU economy a “recession”. He rather preferred the wording of “double crisis”. The double crisis refers to geopolitical impact and “subsequent economic hit” to the EU. As per IMF estimate, the Euro Zone ended 2022 with GDP growth of 3.5%, while expected GDP for this year would account to 0.8% and 1.4% in 2024. At the same time Gentiloni is certain that the Euro Area can avoid a recession.
Crypto market cap
Previous week was a bit volatile for the crypto market considering two important news which hit the market. Both were related to the probability for the first spot BTC Exchange Traded Fund to see the light of the day. First the market was thrilled with the court decision which ruled out in favor of Grayscale, a leading crypto asset management fund, in its lawsuit against SEC for denying the company to convert its Bitcoin Trust into an Exchange Traded Fund. The market perceived positively such a court decision, increasing the probability that the SEC might finally approve the first spot BTC ETF. However, the optimism was soon reverted by the SEC`s decision to postpone the response to all applicants for spot BTC ETF for October this year. Currently the waiting list includes names like BlackRock, WisdomTree, VanEck, Valkyrie Digital Assets and others. On this news, almost all previous gains on the crypto market were erased. Total crypto market capitalization remained flat for another week in a row. Compared to the week before, total market cap was down by $5B, ending the week at a level of $1.025 trillion. Daily trading volumes increased a bit during the week, moving around $60B on a daily basis. This was an increase in volumes from previous week`s $43B. Total crypto market capitalization increase since the beginning of this year remained flat at level of 36%, where it has added total $269B to the market cap.
Crypto coins were traded in a mixed manner during the week. Major coins were mostly on a losing side, while several altcoins had quite a good performance. BTC lost $2B in value or 0.43%, while ETH was down by 0.6% losing more than $1B in value. XRP also finished the week in red, down by $1B or 4.2% w/w. Among other altcoins some of the highest drops in value were with Stellar, which was down by more than 7%, Uniswap dropped by 4.5%, Solana was down by 3.2%. There have been several altcoins with relatively good performance, like Bitcoin Cash, who managed to increase its market cap by 5.15% w/w. IOTA was up by an incredible 9.7%, OMG Network also had a good week with an increase in value of 8.3%. The winner of the week was Maker, which managed to surge by 12% in a single week. As for coins in circulation there has not been significant changes, except for Polkadot, which increased its circulating coins by 5.7% on a weekly basis. Filecoin`s circulating coins were up by 0.5%, while Stellar and Solana also had an increase of coins in circulation by 0.2% both.
Crypto futures market
The crypto futures market has stabilized a bit during the previous week, after a strong downtrend in futures prices since three weeks ago. Short term BTC futures were traded around 2% lower from the end of the week before, while long term futures remained relatively flat on a weekly basis. Futures maturing in December this year, ended the week at price $26.655 without significant change from the previous week. At the same time, December 2024 was last traded at price $29.285, also without significant change on a weekly basis.
ETH short term futures were traded down by 1.5% on average, while there has not been significant changes in prices for longer term futures on a weekly basis. December 2023 ended the week at $1.666, down by 1% from the previous week, while December 2024 was last traded at $1.800, almost flat from the week before.

Total analysis📌📊Total
✅Well, as we said on August 17th and with the emphasis we had on the index falling, this happened and even the possible area for the market reaction was completely engulfed and reacted to the initial area of the uptrend of the index.
❗️Currently, if the index has strength and continues the uptrend, it will continue until the level of 1.116.
✅The possibility of 3 drives of the market movement in the 4-hour time frame is not far from the mind, which causes the supply area to gain more strength, which is indicated in the photo.
#total

Navigating the #TOTAL Market Cap: A Glimpse into Crypto's Future💎The overall health of the cryptocurrency market can be gauged by examining the #TOTAL Market Cap, making it an essential chart for traders and investors. Delving into the #TOTAL weekly chart, the long-term perspective remains optimistic. Notably, the downtrend trendline representing the average price has been breached, accompanied by the formation of a new Higher High. Such developments hint at a potential transition from a bearish to a bullish trend.
💎Post-breakout, the market entered a consolidation phase lasting four months. During this period, the price oscillated between the 1.235T resistance and the 1.000T support. Currently, #TOTAL is undergoing a retest of the significant 1 Trillion mark, which aligns with the Volume Profile support, reinforcing its importance. If this Demand Zone remains unbreached, we might be on the cusp of a substantial 60% surge, targeting the 1.6T resistance. The strength of this resistance is underscored by its alignment with the 327.2% and 38.2% Fibonacci retracement levels.
💎It's worth noting that making long trades now could be akin to catching a falling knife. Nonetheless, our objective at the MCP team is to highlight these pivotal market shifts. By doing so, we hope to empower you to discern bullish indicators promptly, ensuring you maintain a competitive edge in your trading decisions.

Double Trouble Ahead with Head and Shoulder PatternsThe crypto market is revealing a worrisome development - not one, but two head and shoulder patterns. The larger pattern has already experienced a breakdown, which paints a bleak picture for the crypto landscape.
This double whammy of patterns hints at a very bearish outlook for the crypto market. Stay cautious and keep a close watch on market developments.

Wyckoff Accumulation & DistributionThe Wyckoff Method, pioneered by Richard Wyckoff, a prominent figure in the early 1900s stock market, remains a powerful technical analysis-based trading approach. This article delves into the intricacies of the Wyckoff Accumulation and Distribution phases, fundamental to this method.
Who was Richard Wyckoff?
Richard Wyckoff, a highly successful American stock market investor of his time, stands as a pioneer in technical analysis. He transitioned from accumulating personal wealth to addressing what he perceived as market injustices, devising the Wyckoff Method to empower traders against market manipulation. Through various platforms like his own Magazine of Wall Street and Stock Market Technique, Wyckoff disseminated his insights.
The Wyckoff Method:
Wyckoff proposed that markets undergo distinct phases: Accumulation and Distribution. These phases guide traders on when to accumulate or distribute their positions, forming the core of the method.
The Wyckoff Accumulation Phase:
This phase materializes as a sideways, range-bound period subsequent to a prolonged downtrend. During this stage, significant players seek to establish positions without causing dramatic price drops. The accumulation phase comprises six integral components, each serving a vital role:
Preliminary Support (PS): As signs of the downtrend ending emerge, high volume and wider spreads surface. Buyers initiate interest, suggesting the end of selling dominance.
Selling Climax (SC): Characterized by intense selling pressure and panic selling, this phase represents a sharp price decline. Often, price closes well above the lowest point.
Automatic Rally (AR): Late sellers experience a reversal, driven by short sellers covering positions. This phase sets the upper range limit for subsequent consolidation.
Secondary Test (ST): Controlled retesting of lows with minimal volume increase indicates potential reversal.
Spring: A deceptive move resembling a downtrend resumption, designed to deceive and shakeout participants.
Last Point of Support, Back Up, and Sign of Strength (LPS, BU, SOS): Clear shifts in price action mark the transition into the range's start. A rapid, one-sided move signifies buyer control, often following the spring.
Wyckoff Distribution Cycle:
Following Accumulation, the Wyckoff Distribution phase unfolds. This cycle consists of five phases:
Preliminary Supply (PSY): Dominant traders initiate selling after a notable price rise, leading to increased trading volume.
Buying Climax (BC): Retail traders enter positions, driving further price increase. Dominant traders capitalize on premium prices to sell.
Automatic Reaction (AR): The end of the BC phase brings a price drop due to decreased buying. High supply causes a decline to the AR level.
Secondary Test (ST): Price retests the BC range, assessing supply and demand balance.
Sign of Weakness, Last Point of Supply, Upthrust After Distribution (SOW, LPSY, UTAD): SOW signals price weakness, LPSY tests support, and UTAD might occur near cycle's end, pushing the upper boundary.
Wyckoff Reaccumulation and Redistribution Cycles:
Reaccumulation occurs during uptrends, as dominant traders accumulate shares during price pauses. Redistribution, during downtrends, begins with sharp price rallies as short sellers capitalize.
Dominant traders strategically enter positions during these rallies.
Wyckoff's Foundational Concepts:
Law of Supply and Demand:
Prices rise when demand is high and supply is low. Prices fall when supply is high and demand is low. Balanced supply and demand lead to stable prices.
Law of Cause and Effect:
Price changes are driven by specific underlying factors. Price rises result from accumulation phases, while drops arise from distribution phases.
Law of Effort vs. Result:
Trading volume should match price movement. Deviations signal potential shifts in market sentiment or upcoming opportunities.
The Wyckoff Method is relevant to all markets, including cryptocurrencies like Bitcoin, where supply and demand play a crucial role in influencing price movements.

TOTAL UpdateTOTAL is dump lower than i expected.
But still, i ain't believe that we're gonna trading below 1T, but if it's happen, i'll call it a fire sale.
Trade safely.

Crypto Market Cap (TOTAL1) – A Bigger PictureConfluence resides within the Dec 15–Dec 24 date range and sits at 542B.
