MARKET UPDATE— August 1st, 2025“Handle before lift-off? Or is the bull year cooling off?”
Let’s address the question everyone is silently asking:
Are we nearing the end of the bull year… or is this just the calm before the next storm?
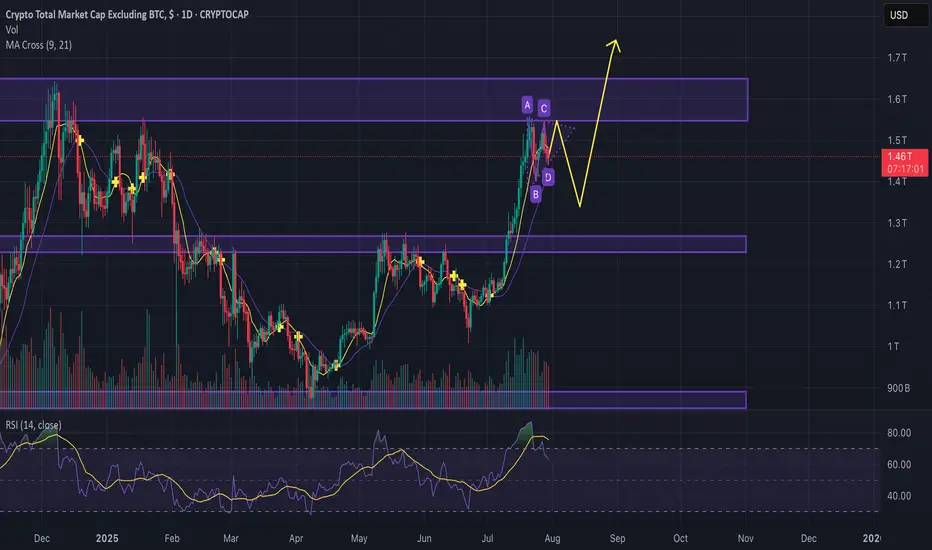
1. Total Market Cap (ALTS): Cup & Handle in Motion
We’ve observed something beautiful fo
Key data points
Previous close
—
Open
—
Day's range
—
About Crypto Total Market Cap Excluding BTC, $
Bitcoin is quite a heavy-weight fighter which makes it difficult at times to correctly define how the crypto market is doing — it just outshines other coins, and you can't see clearly. Since Bitcoin presents such a huge piece of the crypto pie, excluding it from counting sounds reasonable and lets you see a more clear picture of where the crypto market is moving at the moment. That is what you can see on the chart we've prepared — calculated by TradingView, it displays global crypto market cap without Bitcoin's share.
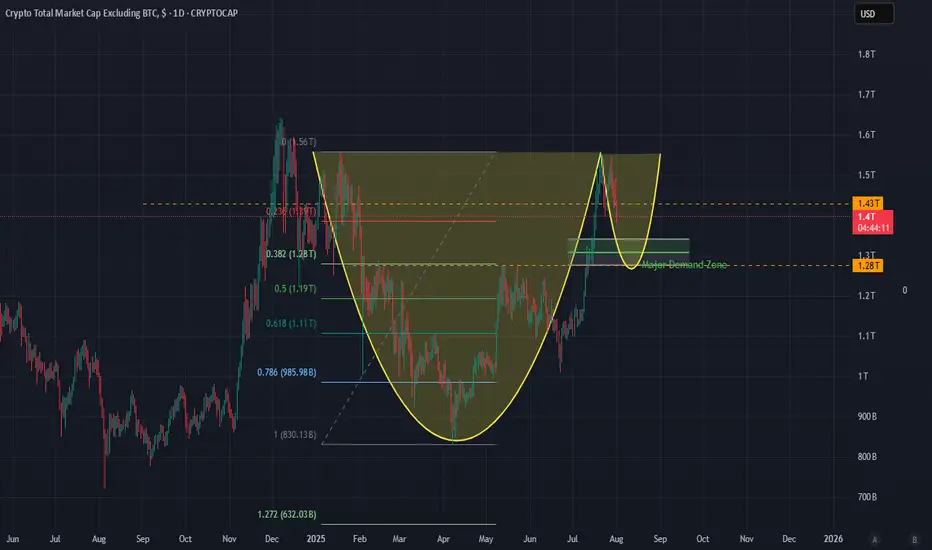
Huge multi-year Cup and Handle Formation for CRYPTO ALTSThe alts are on the cusp of breaking out from a mult-year cup and handle pattern. With macro factors in a continuously positive environment and momentum, the technical bull case cup and handle formation all point to a massive breakout. Stay tuned and keep safe!
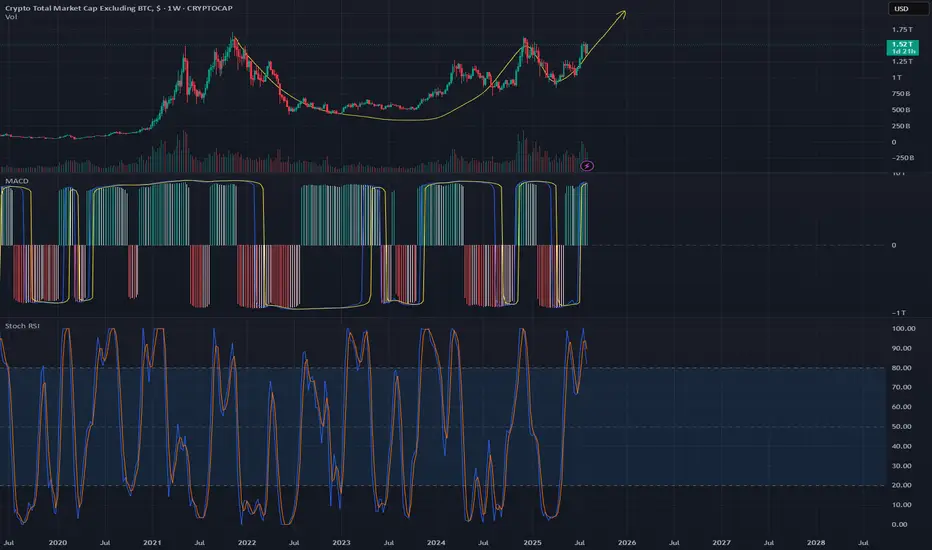
Total 2 --- Long For ALTshi
as i said in BTC.D and USDT.d analyse this charts has correction potential , if thats occure and market makers looks to ALTs . total 2 make a good high and show green ALTs market for some weeks.
it's my peronal idea for this chart , please do not make and inveting and trading on my analyse

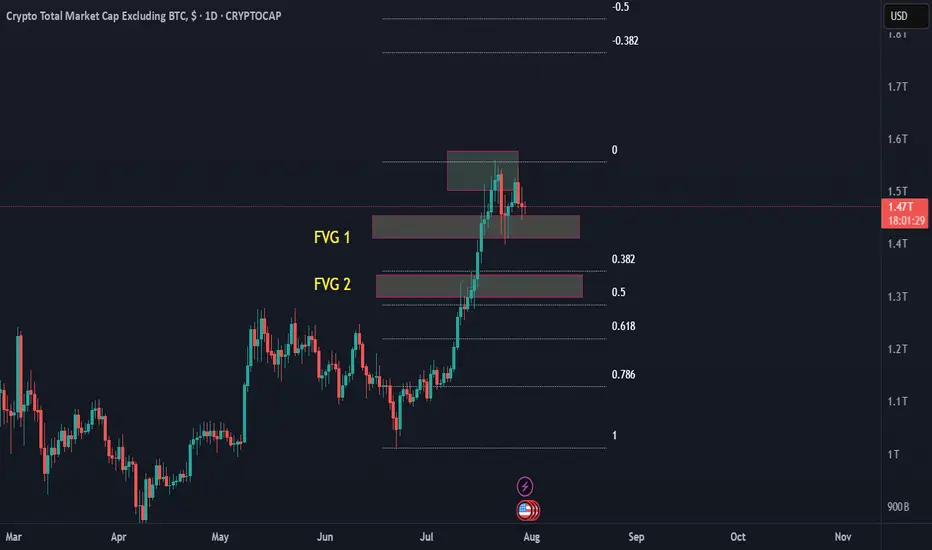
TOTAL 2 - Trend Analysis Updated Price Action Insights:
Price rejected cleanly from the upper FVG near 1.55T (still acting as dominant resistance).
Now consolidating / weakening under FVG 1, after briefly testing it.
Lower highs are forming, and price is struggling to reclaim key levels = signs of bearish structure develop
TOTAL2 1D – Altcoin Market CapAltcoin market cap excluding BTC. Used to measure overall altcoin trend and volume strength.

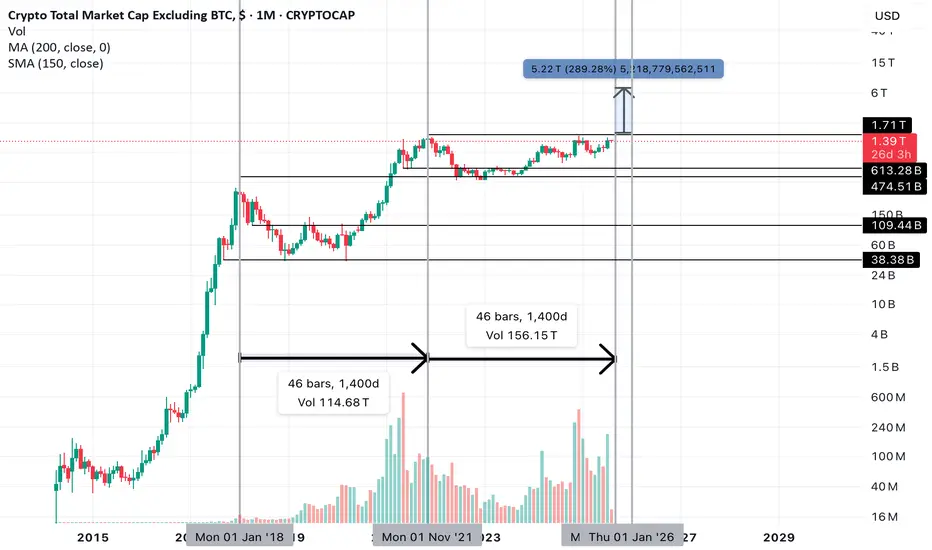
Alt Season? Buy dips, then run it turbo. 1400 days...? Then up. It took exactly 1400 days from the previous all time high (ATH) set in alts (excluding BTC) in early Jan 2018 to break that level again in 2021 to form our current all time high resistance.
Alts have tapped the ATH set in 2021 3-4 times. And it will be 1400 days since the last all time high on Sept
Is altcoin season over before it even started?Guys,
Gonna break down the situation on the chart to see where we can go next with the altcoins.
We see the key resistance levels and now we moving in kinda bullish pennant, but considering descending volumes we can easily test the support line and go back to the 1.25T. (maybe even lower)
After
Ethereum Staking Strain Exposed — Daxprime Weighs InIn July, the Ethereum ecosystem faced a new challenge: a sharp increase in the staking exit queue revealed structural weaknesses in the current liquid staking architecture. Within just a few days, more than 75,000 validators submitted requests to exit, causing temporary disruptions in certain deriva
Crypto VC Sees Resurgence — Satsuma Raises $135M, QCEX Secures $Amid persistent market volatility and macroeconomic uncertainty, venture capital is once again flowing into the crypto sector — and doing so with conviction. In recent weeks, two major players, Satsuma and QCEX, closed significant funding rounds, raising a combined $247 million. These deals signal a
Solana (SOL) Revs Up Again — Fresh Breakout Above $200 in Sight?After months of consolidation, Solana (SOL) is once again showing signs of bullish momentum, trading near $176 and rapidly approaching a potential breakout level of $200. Investors and analysts alike are paying close attention, as on-chain activity and ecosystem development provide a compelling case
See all ideas
Summarizing what the indicators are suggesting.
Oscillators
Neutral
SellBuy
Strong sellStrong buy
Strong sellSellNeutralBuyStrong buy
Oscillators
Neutral
SellBuy
Strong sellStrong buy
Strong sellSellNeutralBuyStrong buy
Summary
Neutral
SellBuy
Strong sellStrong buy
Strong sellSellNeutralBuyStrong buy
Summary
Neutral
SellBuy
Strong sellStrong buy
Strong sellSellNeutralBuyStrong buy
Summary
Neutral
SellBuy
Strong sellStrong buy
Strong sellSellNeutralBuyStrong buy
Moving Averages
Neutral
SellBuy
Strong sellStrong buy
Strong sellSellNeutralBuyStrong buy
Moving Averages
Neutral
SellBuy
Strong sellStrong buy
Strong sellSellNeutralBuyStrong buy
Displays a symbol's price movements over previous years to identify recurring trends.