Is it time for alts?When secondary trendline us briken it is nice to see change of structure. Last time (red lines) it failed. This time we are close to break new secondary trendline. I can se two tops to overcome (yellow horizontal). I don't like this one higher because alts can run really hard really fast. So this one feel late to the party. I will use the lower one to change a bit of BTC into high/medium caps.
TOTAL2 trade ideas

Altcoin Market at a Key Level – Breakout or Pullback? | TOTAL2
Hey traders! 👋 The altcoin market cap (TOTAL2) is at an exciting turning point as it tests the **0.236 Fibonacci retracement level (~$1.33T)**. This level has been a key resistance in the past, and the market’s behavior here will likely decide the next big move. Let’s break it down:
What’s Happening?
🔹 The market is testing **$1.33T**, which has been a tough resistance zone historically (see those red circles).
🔹 Strong volume recently suggests growing bullish momentum, which could help push through this level.
🔹 RSI shows the market is nearing overbought levels, so it’s worth watching for signs of either a breakout or a pullback.
**Possible Scenarios**
🚀 **Bullish Breakout**:
- A weekly close above $1.33T could signal that the market is ready for its next leg up.
🛑 **Rejection/Pullback**:
- If the market gets rejected, there may be opportunities to re-enter at lower levels, especially near key support zones.
**Key Takeaways**
📈 Altcoins are showing signs of strength, but this is a critical resistance to watch.
⚡ A breakout could lead to a strong move higher, while a rejection may offer better opportunities on pullbacks.
What do you think? Is the altcoin market ready to break out, or is a pullback more likely? Let’s discuss in the comments! 💬

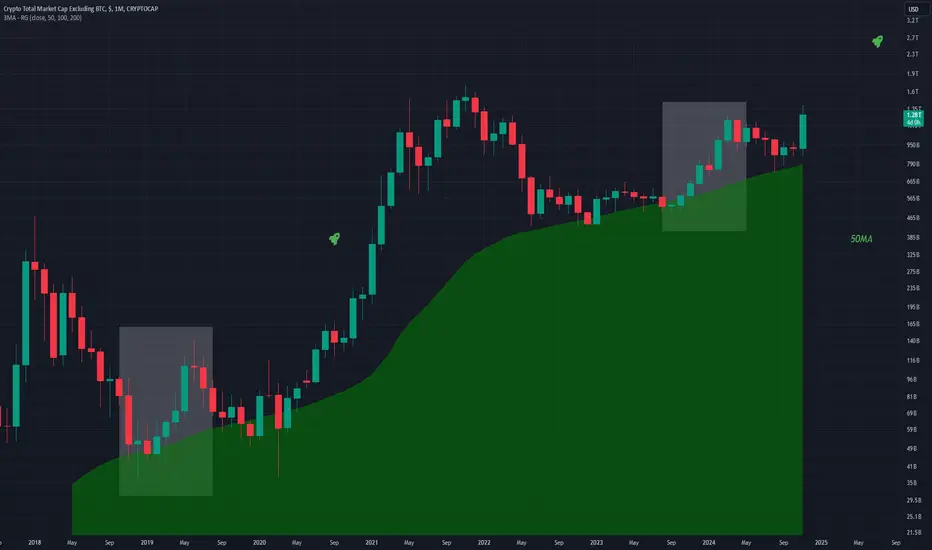
TOTAL2 - Monthly MA Intact Each move in white is the beginning of a bull run, a move that shows strength followed by a short term move back down towards the 50MA.
The MA acts as support and allows the TRUE breakout to be revealed, we will see the bullish action for real in 2025.
What are your thoughts on how high this altcoin chart will go on this Monthly chart?
#Altcoin major run has just begun!#Alts market cap TOTAL2 handle cup pattern neckline break and retest followed by major run will be inevitable!

#Altcoins run it back!#Alts market cap TOTAL2 and TOTAL3 breakout and closing was made on a weekly basis at the level corresponding to the March April 2022 and March April 2024 major resistance area and also the handle cup formation neckline area.
#Altseason is approaching!

Altcoin Rally on the Horizon? Watch This Level!The total crypto market cap excluding BTC (Total 2), currently in a downtrend within a descending channel. It recently broke through a key resistance zone Blue at 962.013B - 976.72B mark. The green projection suggests a potential breakout from this channel, with a bullish target near 1.271T. If the breakout holds, it could signal a strong uptrend and potential alt season ahead.

Who wants some CUP of tea? Total2 is exploding soonbasically the chart explains itself, we will see big upward movements in the total2 chart. Cup and handle is confirming

Without patience, there is nothing else to do in this market.So, we have the first positive signal, but we need to wait one more week for the monthly candle to close like this.
1. The candle has risen above the cloud boundaries and crosses the Kijun and Tenkan indication lines.
2. WaveTrend oscillator shows a bullish signal, but we need to wait for the candle to close like this.
3. Let's pay attention to the length of the red clouds. It is in this interval that the market reaches a new peak approximately in the middle of the cloud, followed by a correction. The last time the cloud was formed was from October 2020 to February 2023. The top of the market is December 2021. Now the cloud is in the segment 1 January 2025 - 1 September 2026. The midpoint of this cycle is October 2025.
We'll be watching.

Step by step towards #Altseason#Altcoins are just starting to wake up!
#Alts market cap broke the TOTAL2 $1.27 trillion level, which was the major resistance on March 2024, and also the neckline of the cup handle formation, will move towards the all-time high of $1.71 trillion after the weekly close and retest!

Golden Cross kickstarts Altcoin SeasonExactly as I was predicting it would just as it did for total2, xlm, and quite a few other crypto charts recently. I expect the trend will continue. I will link the hart to the total2 cup and handle we seem to have confirmed the breakout from below. *not financial advice*

TOTAL2 Long TermAfter Sideway in wave 4 of elliot. Total2 break trend and target will be 1.384T - 1.493T.

Another 460 billion for AltsHello everyone,
Just want ot inform that another 460B is remaining to reach the next support level for altcoins. Given MACD is good and stoch RSI in range with crossover from october we still have time to see the boom.
Weekly chart have stoch RSI at 100 so I would be careful on buying until i see a correction. the next level of fibonacci support is at 1.01T if correction is to happen. Dont be discouraged this is the buying oppourtunity for anyone whi is left out for the next push.
Just a thought on the market

TOTAL2 - Bullish Breakout, Alt Season Could Be Upon UsTotal Crypto Market Cap excluding Bitcoin. Alts may be ready to explode!

Correction to the Alts on the horizon?Many thanks to @without_worries
Using the Pivots High Low Line by DiZer, one can see that the alt coin market cap is approaching a key resistance level. Also please observe the the MACD indicator which may have a bearish cross over soon and the RSI level which is near the overbought zone. A correction to the alt coins may be on the horizon. Please check out @without_worries for his excellent TA where he talks about life crosses and other fundamentals pertaining to this matter.

For the ones saying , alts are dead. remember this pattern?Cup and handle, send it. similar TA to my bitcoin analysis when everyone said at 90k it would 'die'

TOTAL2 - Still BullishI am still very bullish on alts, more than I am on BTCUSD.
A divergence is occurring where the RSI on this hourly timeframe is moving downward while price is trending upwards. This is a bull sign.
Alts pumping around the board.

ALT Season? Not Even CloseWhen we exclude Bitcoin from the total crypto market cap, it becomes clear that we’re far from the conditions needed for an ALT season. Here’s a breakdown:
First Resistance: $1.28T (Excluding BTC)
The last high was in March 2024, with the market cap reaching $1.28T.
At that time, BTC dominance was around 52%.
Second Resistance: $1.71T (Excluding BTC)
This was the peak during the ALT season in November 2021, with the market cap hitting $1.71T. Back then, BTC dominance had dropped to just 42%.
Current Situation
BTC dominance is now sitting at 60%, which is far too high for a typical ALT season to start.
Historically, ALT seasons tend to begin when BTC dominance falls below 50% or even lower.
Conclusion
The altcoin market has a long way to go before reaching the conditions for a true ALT season. We need BTC dominance to decline significantly and the altcoin market cap to break through key resistance levels at $1.28T and $1.71T.
What’s your outlook? Are altcoins still in Bitcoin’s shadow, or is a shift coming? Let’s discuss!

Tic... Tock... #Altcoins #Alts market cap #TOTAL2 -weekly falling trend breakout has been completed and will start the major uptrend wave after the retest.
We also witness a transition from the RE-ACCUMULATION phase of the wyckoff cycle to the MARK-UP phase.
#Altseason process will happen there sooner or later!

Total 2 at the verge of a break through We are looking a Total 2 , this breaking through means btc domiance dropping an altcoins have their way

A close up of the bullflag forming above c&h rimline on total2The red line is the rimline of the Total2 chart’s cup and handle pattern that I made a post about a few days ago and will link at the bottom of this post. I thought it would be a good idea to include a close up of this bull flag that is forming with that redline mostly serving as support here so it would be easier for people to see when the breakout from the cup and handle will be validated. Once we have solidified the red line as support long enough we will validate the breakout from the cup and handle. One thing that will greatly increase the probability that w will validate that breakout is by first valdating the breakout up from this smaller bullflag pattern that has been forming here, you’ll notice that we are also about to have a golden cross (when the orange line crosses above the blue line ). We are now just one to two days away max from that cross happening and I would not be surprised if the pump up from the bullflag that validates it’s breakout occurs the same day the golden cross occurs, as I have already seen that happen immediately on the golden cross in two other chart recently, and it usually tends to do so once we have entered the parabolic phase of the bull market. If we do we will simultaneously validated both the breakout from this bull flag and mostly likely validate the breakout from the more macro timeframe Cup and handle pattern as well. I will link the chart I posted a few days ago showing the full cup and handle pattern down below. We’ve already seen a slight bit of a precursor already in the market but once the cup and handle validates its breakout, it is officially alt season. *not financial advice*

Moving Average Positions (50,100,200)Normally when bear moves arise the 50 and 100 are above the 200 as there is more room for a downward move than an upward one.
Right now the 50 and 100 are BELOW the 200, which suggests that they have more room to move up ABOVE the 200MA in red, which would happen during a bull move.
Observation of the MA's
Comment if you think otherwise !
Daily timeframe

#Altcoins are preparing for a Parabolic run!#Alts will turn into #altseason after RE-ACCUMULATION stage according to Wyckoof cycle and will start epic rise!

Basic TA: From Bearish To Bullish (Downtrend Broken)The worst mistake that can be made after being bearish when a market is not rising, is to be bearish when the market is rising.
Look at this chart, this is TOTAL2. This week is young, just last week there was a bullish breakout above the black descending (downtrend) line. Last week the bearish bias/trend was broken and the market enters and uptrend.
A mistake can be made to be bearish when the market is going down, because it turned. But an even worse mistake is to stay bearish when the market is clearly breaking up.
The correction is over and the bearish bias is nullify by a high volume bullish breakout. The bullish breakout confirms the start of a new bullish trend. Not the end, the start. The start of the bullish trend can go for months or even years. The correction is not starting, it is now confirmed over. The confirmation comes from the action switching from lower highs to higher highs and higher lows.
We had lower highs from 11-March until 28-October. We now have a higher high and this is supported by high volume. In this case, based on technical analysis and price action, we switch our bias from bearish to bullish.
Thank you for reading.
Namaste.
