At the beginning of the #Altcoin bull run!The reaction rises that started with q4 2024 will turn into a parabolic wave with q1 2025 for #alts
TOTAL2 trade ideas
total market capIf we close a daily candle above $1.1 trillion, we can be confident that the altcoin season has officially begun CRYPTOCAP:TOTAL2

Altcoin Season! C&H pattern can take altcoins to 2 trillion!Price action has now finished the handle on the total2 charts cup and handle as well as closed a Daly candle above it. Now we need to close a weekly candle above it and make sure we’ve flipped the rimline to solidified support so we can trigger and validate the breakout. If so the measured move line takes price to a target of 1.99 trillion! The journey to that target would make for one unforgettably epic altcoin season no doubt. *not financial advice*

TOTAL2 - Way UpUsing bars pattern and a curved trendline to plot a way up towards the stars for the altcoin market after Bitcoin finishes its move and lets alts to clean this up.
Very bullish right now.
Daily chart

Alt coins alt seasonI was expecting. A small correction yesterday but after checking the monthly and weekly chart .seems to me alts can easily +50% from now . Historically when btc has a bull run when btc start to consolidate money will flow back to alts in hopes for much better profits . That’s how it works . Some alt coins are already an overbought like doge and sui and some meme coins . We should see money flow to low cap alts next I expect

Total 2 alt coins idea I think the market will consolidate for a couple days before moving higher . It is now touching the 1 week resistance . It would be nice to get a small pull back to buy more . I sold some of the positions here

ALTS ARE ABOUT TO MOONWeekly close is happening tonight and the RSI AND TSI are both making positive divergences. RSI is clear to soar as it s breaking out of the cup and handle pattern. TSI just created a cross that is very rare and has a high success rate. New all multi-week gains are around the corner.
NOT F.A.

#TOTAL2 Breaking out#TOTAL2 Breaking out.
Breakout of main trenline.
Breakout of MA
Breakout of high volume.
See you on the Moon 🌙

#Altseason loading step by step!Just like in the 2020-2021 period, I feel the #Altcoins run again in my bones in the 2024-2025 period.
#Alts run will melt all faces again and add new millionaires to the community of believers!

TOTAL2 alpha analysis and targetstotal2 alpha ,reched 1.27T , we shared 1.4T last year which is 10% higher only not bad . Clean structure here after retesting the accumulation range at 701B (yellow range ) , took off till 1.27T which is the top of 2022 first drop range(black range) and took the highs .
Corrected 43% from there and almost retouched the accumulation range .
Now , back into black range and cyan (cyan range is almost identical to black , however cyan is the latest range total 2 trading in for the last 250days ) . Now we are breaking the first grey box which showed resistance for the last 90day. Acceptance above it will lead the way to 1.5T then 1.27T (top of black and cyan range ) . After that 1.5T woule be in play .
2.5-2.7T is my finale target for this cycle imo .

TOTAL2 alpha analysis and targets total2 alpha ,reched 1.27T , we shared 1.4T last year which is 10% higher only not bad . Clean structure here after retesting the accumulation range at 701B (yellow range ) , took off till 1.27T which is the top of 2022 first drop range(black range) and took the highs .
Corrected 43% from there and almost retouched the accumulation range .
Now , back into black range and cyan (cyan range is almost identical to black , however cyan is the latest range total 2 trading in for the last 250days ) . Now we are breaking the first grey box which showed resistance for the last 90day. Acceptance above it will lead the way to 1.5T then 1.27T (top of black and cyan range ) . After that 1.5T woule be in play .
2.5-2.7T is my finale target for this cycle imo .
this is not a financial advice
thank you


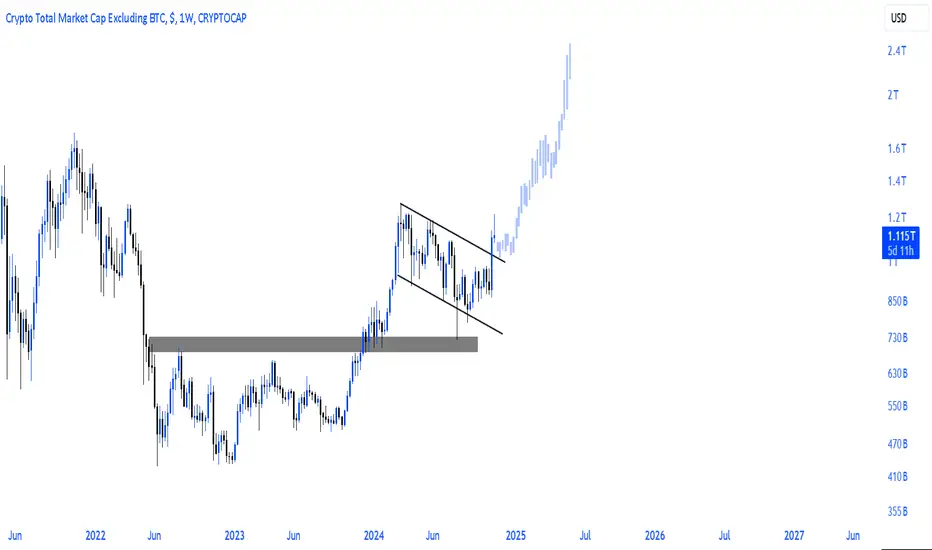
Total 2This chart of the total crypto market cap (excluding BTC) shows a symmetrical triangle pattern within a broader descending wedge. Price is near the triangle’s upper resistance, suggesting a potential breakout or breakdown. The Blue resistance zone is very important to flip for bullish moves.
Everything is on the chart

TOTAL2 - Bullish Going Into Christmas Going to see a breakout from this long down channel we have experienced
I have shown this breakout with the bars pattern tool in green
The down channel is finished in this view.
4Hour chart

Gearing up for Altseason The total market cap of Altcoins is currently in an ascending triangle at the point of multiple confluences. An Ascending triangle, hrozintal and diagonal resistance lines and also at the 0.5 Fibonacci line (not shown). If we break above all these resistances, alteason will be highly likely to start.

Cryptocurrency 2024 Grand Finale: The Path RevealedThis is what is truly happening right now, we are still caught within the bears paths, Cryptocurrency is moving within a descending channel and creating a strong bearish flag.
Don't get all caught up in the hype. Patience is key!
How long does a bull-market last?
12 months? 16 months? Longer?
So there is no hurry in letting the market produce its final shakeout before we get a clear picture as to what happens next.
We have one goal and one need only, and that is to get the best prices possible to position ourselves for long-term growth.
Opportunities are endless in this market, if one opportunity goes, another shows up.
We know where we are headed next...
👉 Bitcoin and the Cryptocurrency market is going to grow really strong in 2025, but 2024 is not over yet.
Thank you for reading.
Your support is appreciated.
Namaste.

2025 altcoin season?I can see a bearflag breaking out downwards. Im hoping it will reach the 656 level before we get the sickest bullmarket ever. Pet alarm on trendline. Trade save.

TOTAL2 - Down Channel BreakoutDrawn is a down channel on the 4hr chart for TOTAL2 which is the altcoin market cap.
I think this down channel is currently trying to be broken with a break up.
Very bullish heading into November and Christmas period.

TOTAL2 Update - Oct 27 2024Following previous analysis, TOTAL2 dumped and moved towards the lower trendline.
Although the trendline got broken, 12H candles closed on the trendline so the mentioned trendline is still valid but 4H analysis suggests that TOTAL2 is probably gonna cross below it.
TOTAL2 is facing the combined resistance of blue descending trendline and 0.618 Fib ret. of the previous drop, so it's possible to see another dump in the market over the next couple of days.

Total2: The Final Crash Of 2024The Cryptocurrency market bearish wave is intensifying... Here we have a triple top within a strong descending channel.
Many of our public SHORTs are hitting targets and everything is pointing toward a major flush happening soon.
Keep in mind that it is hard to see these things coming. I mean, it is hard to accept them because we can see it happening and yet we ignore it or have a feeling of disbelief, like now. It is happening but somehow we can get the impression that all is fine, prices will recover the next day, while the index and Cryptocurrency has been moving down since March 2024.
Now think back to August. By the time we accept what is actually happening it is already too late. It is tricky these markets. When prices are going down we feel certain of something up. When prices are going up we tend to doubt thinking that there can be a crash any day.
The Cryptocurrency market bearish wave is intensifying and we've seen nothing yet. The good news is that it will be fast when it happens because it has been in the making for so long. When the market consolidates a move for a long time, it is because the move is going to be really strong.
Prepare for the crash —The final crash of 2024.
Namaste.

ALTS MARKET CAP ANALYSIS - 1DThe ALTS market cap is currently consolidating within an ascending triangle pattern
A decisive breakout above this resistance would confirm a bullish rally in the ALTS market, while a breakdown could indicate further consolidation or a potential pullback. Patience is key as we await confirmation of the next trend direction.

TOTAL 2 breakout soon!!I believe we're headed for one more dip in altcoins before we break out of this triangle pattern, potentially targeting a market cap of $1.6 trillion. This could lead to 3x to 6x gains across the altcoin space.
We're currently in the final stages of the Wave 4 pattern, and as it concludes, Wave 5 is set to emerge as the next phase.

TOTAL2 update - Oct 22 2024It's clear that TOTAL2 faced resistance in 980B level so the dump in most altcoins is no surprise.
Analysis suggests that TOTAL2 is heading for the lower trendline but if the trendline gets broken, intense sell pressure will probably appear in the market and coins will dump more.
If the trendline holds well, it's possible to see some nice pump in the entire market following the breaking of the upper trendline.
