Altseason is cancelled for now. But Should resume soon.If you're interested in altcoins, be sure to check out my ideas. I’m closely tracking CRYPTOCAP:BTC.D and CRYPTOCAP:OTHERS , and you’ll find plenty of valuable insights in those analyses.
So, what’s going on? My CRYPTOCAP:OTHERS prediction played out — May was bullish. But was it the real altseason? Not quite. The true altseason typically begins at the end of the Bitcoin cycle, and we’re not there yet.
Right now, we’re seeing price action reminiscent of December 2024. Bitcoin maximalists are aggressively buying BTC during a time it should be correcting, which is inflating BTC dominance and crushing any momentum for an altseason. They appear to be using altcoins as exit liquidity to pump BTC, especially as retail investors hesitate to buy Bitcoin above $100K.
What’s next?
The daily MACD suggests we’re entering a correction phase that could last around two weeks. A drop toward $1.2T is likely, as there's a major order block between the current level and that target. However, the real support lies below $900B — my "green box" — which I view as the ideal buy zone.
Historically, entries in this green box have offered 2x–3x returns on high-volatility altcoins from the top 100, especially in sectors like memes, DeFi, and AI.
I expect altcoins to correct into that zone in the coming weeks — keep an eye on it.
DYOR (Do Your Own Research).
#Crypto #Altcoins #Bitcoin #BTC #BTCdominance #Altseason #CryptoMarket #CryptoTrading #MACD #TechnicalAnalysis #DeFi #MemeCoins #AIcoins #AltcoinSeason #DYOR
TOTAL2 trade ideas

Altseason Isn’t Over – It’s Just Getting Started !!It’s not the end of #Altcoins this is just a small dip before the big move. 🚀
Right now, all EMAs (50, 100, 200) are sitting at the same level. This is acting as very strong support around the $1.12T zone.
Price has bounced from this area before, and if it holds again, we could see a big breakout toward $1.28T+.
Altseason isn’t over. It’s loading.
Be ready. 👀
#TOTAL2 #Altseason2025

Top 10 Altcoins Yet To Move, Strong Growth Potential —CommentI am making a list of TOP 10 Altcoins that are yet to move. These are not the ones with the highest growth potential nor anything like it but a selection of pairs that are yet to move strongly thus low risk vs a high potential for reward.
Let me give you some examples and then I will share the instructions below.
» PEPEUSDT grew some 200% already. This is awesome but it wouldn't be in the TOP 10 yet to move because it already grew strongly. It has plenty of room left available for additional growth but the higher it trades, the higher the risk.
» ETCUSDT grew less than 70%. This one is still trading low so it has huge potential for growth, it can be part of the TOP 10 Altcoins yet to move.
Let me give you another example:
» DOGSUSDT grew 150% already. It is currently trading below the last high of course but this one wouldn't make it in the list. We already jumped in early so we look for other pairs.
» AVAXUSDT grew a maximum of ~80% and is now trading only 55% higher compared to its 7-April low. This can be in the set of the TOP 10 Altcoins yet to move. Makes sense?
Like this, I will make a list.
If you are interested, leave a comment with "Share the TOP 10 Altcoins Yet Move" and if there is enough interactions I will do this post for you.
I can take a while because I will go through hundreds of pairs. Depending on how much interest there is, I can do another TOP10 and another TOP10, 3 sessions total, because there just too many Altcoins that are looking great and yet to move.
Sounds good?
Leave your comment below and let me know.
Namaste.

TOTAL 2Total Altcoins Market Cap is at resistance level at $966B and descending channel upper boindary. A breakout from here could signal a strong shift in momentum

Total 2 breakout patternThis chart doesn’t lie.
Altcoin market cap has officially broken out.
2020: 10x.
2025: Starts from $1T.
The scale of what’s coming? Unimaginable.
total2total2
seems like an important month, this month close will show us a decent way
first: above box means printing money
second:inside box with that filling scam wick, means next month can be seriously painful
yet still chance that its just bear trap for good traders
I'll guess its just a good trap for good traders
at least
i hope so

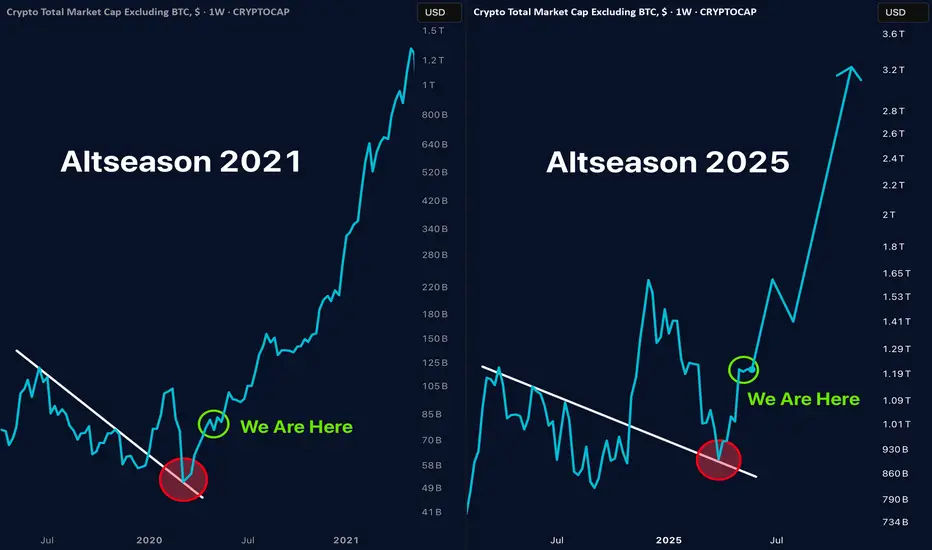
Altcoin season Unpopular opinion:
This altseason will make 2021 look tiny.
The charts are screaming it.
The patterns are perfect.
Your only question should be: How big?

Test phase 1.0 This wil be a test post to see how things work. Crypto is evolving fast—new narratives, new tech, and new money flows. From DeFi to AI agents, the opportunities are wild. Blink and you’ll miss the next 10x. Stay sharp. Stay early. Stay winning.

TOTAL2 - Great Bullish SetupGreat position for the bulls
Weekly chart so its gonna be a long position
Bullish bounce off the MA is expected and new ATH's for ETH and BTC will come
Weekly timeframe

TOTAL2 - AltseasonMonthly observation of the alt coin market cap chart
Looks like the bulls are in for a treat
Very bullish favor
50MA has held quite well
Monthly chart

TOTAL 2Total2 next coming zones.
First is the 730 then bounce then crash to 400-230 area then bullrun start

What Happens If I Am Late? (Trading Strategy For Beginners)It can happen that for whatever reason you couldn't buy when the market was trading at bottom prices. What then? Am I too late?
It is unwise to buy at any random price and even less with 10X cross leverage. I've seen people doing just that and buying at the top of the range. While it is never too late in relation to the overall market cycle, it can be late for a certain pair.
The time to buy is near support. If bottom prices are not possible, the best option is to wait. Say you miss Bitcoin at $78,800 and prices start to advance. When prices are moving up at $84,000 and rising you can just wait. But if prices peak at $88,000 and then retrace to $84,000, consolidate as a higher low this becomes a second entry. The same when Bitcoin retraced from $95,000 and moved to the $91,000 - $93,000 range. This range becomes a second entry.
Rather than rushing and buying when prices trade, say at $106,000, at the top of the move, we wait for a retrace. If this isn't possible we simply look for another pair.
It is never too late because it depends on what strategy we are using, our Cryptocurrency Trading Plan, and trading style. If you are doing leverage it will depend on the chart setup and the amount of leverage you are using. If you are doing spot, it depends on your goals more than anything because buying can be done at any given time based on the long-term.
It is unwise to rush into Ethereum at $2,500 because you missed $1,600. And you say, "I didn't have any money and I didn't want to miss out." With 10X? What if you lose everything on a flash crash, are you missing out now?
The thing is, that all the pairs are the same when it comes to profits potential. We are looking for a win. So if a pair has a low probability of producing a successful trade, it is no good regardless of the name.
Patience is key.
You can use the comments section to ask questions.
It is not about "breaking the trading rules," it is about your money.
Have you considered what would happen if the market flash crashes just to liquidate you and those in a similar position to yours and then moves up?
You didn't want to miss out, but this not missing out can result in a major loss. It is better to plan and take action based on a strategy rather than rushing, the market is not going away.
Opportunities are endless, and every single day I will be sharing new charts. Some pairs are trading near support and at bottom prices, those are always the best because of the lower risk.
Low risk vs a high potential for reward.
Plan ahead.
Namaste.

Rounded Top Above 200MA A chart for the altcoin market showing a rounded structure forming above the 200MA on this daily chart
The 200MA will likely act as support and allow price to move higher
Still bullish for alt coins

Altcoin market capLooking forward to the next 6 months. Nothing is sure but it definitely looks interesting 😀

Total 2 MarketcapHi
As i said about more then 400 days ago , there is way that is expext and forcast for ALT coins
i think we have no ALTs season until all of retail investor feel pain :))
its only my peronal idea and i dont suggest anyone to Buy/Sell anythink
Sincerely Yours
Mehdi Khamisi Zadeh

$TOTAL2: Altcoin bull market until April 2026Signal flashing here, very promising outlook for altcoins...
Follow me for more insights on how to maximize profits in the coming bullish cycle that is forming now, check out my signature for more info.
Best of luck!
Cheers,
Ivan Labrie.

THIS IS THE ALTCOIN YEAR! MARK MY WORDS!We exceed 1.46T its end game for bears, money will flow into altcoins like no other! Another hysterical rally something similar or even harder than 2021! and I cant bloody wait!!!!!
Exciting times ahead of us! LFGO!

TOTAL2 - Broadening StructureA structure that allows continuation upwards on this daily timeframe
Price has become very bullish
It has been sitting at 1T for too long, extension is likely
This is an ascending broadening structure

TOTAL 2 ANALYSEThe longer BTC dominance continues to decline, the more likely it is that Total 2 will break through key resistance levels.
For now, I’m anticipating a retest of the highlighted area, which would support a logical continuation to the upside, in line with the H4 analysis on BTC dominance.

TOTAL 2 could reclaim 1.27T market cap Hello Traders 🐺
In my previous ideas, I tried to focus on the long- and mid-term perspective and showed you a nice and clear path toward the probable price targets for the upcoming Altcoin season. Now, I want to keep updating you all the way to the upside — so this idea is just a quick update for you, my dear audience, to keep you informed about the current possible price targets. If you're also interested in the long-term view, I’ve put the related links down below this idea !
As you can see on the chart above, the price is breaking above the orange resistance line and trying to reclaim the $1.27T market cap, potentially retesting it as new support. However, we may see some sell pressure near the resistance box since it's also aligned with our mid-term downward-sloping channel — which, as we discussed earlier, could also be interpreted as a bull flag 🟧📈
So make sure to load your Altcoin bags 🎒 — because in my humble opinion, there’s a clear and free path toward the red resistance box above.
And as always, follow our golden rule and avoid any FOMO:
🐺 Discipline is rarely enjoyable, but almost always profitable. 🐺
🐺 KIU_COIN 🐺

TOTAL2 - Move Down SimilaritiesSimilar situations within green rectangle
Prior move down found support and moved upward
I think this will be the same for the current retracement hence the green bars pattern upwards
Lets see how high it goes

TOTAL2 + TOTAL3 + OTHERSALTSEASON is the essence of the market and is inevitable!
TOTAL2 + TOTAL3 + OTHERS 💹

TOTAL2 - Daily Rounded TopA Rounded Top structure
these patterns usually break out to the bullish side once completed as shown with the arrow
Right now this structure has perched itself above an MA and is looking to move higher
Good buy into alts right now in hopes of an altseason
