6 Altcoins that could POP as soon as this weekend!Traders,
Just wanted to cover my current trades/trade strategy as well as some potential winners. I have picked out a short list of coins that could pop as soon as this weekend or into next week.
If you don't want to watch the whole video the coins are: DOT, GODS, Powr, APE, Storj, and JASMY.
Best,
Stew
TOTAL2 trade ideas

total 2Total two important indicators for alt coins.According to total 2, the rise in alt coins is starting
double bottomed.It's too early to say anything but the bulls may be starting for the bottoms

ALTS Exciting time to be invested in the crypto market.The altcoin market is one of the markets that deserves our attention as we close 2023 and start the new year. We have been mentioning that on numerous analyses but the current idea couldn't display it in a simpler, yet more informative way.
As you see this is the total market cap excluding Bitcoin (TOTAL2) on the 1M time-frame. The 1M MA5 (blue trend-line) is about to cross above the 1M MA20 (green trend-line) and form the first such Bullish Cross pattern since April 2020. The only time besides this one that we had such pattern formed was on February 2016. What followed after both sequences was insane parabolic rallies, what is known in the market as 'altseason'. The 1M RSI patterns of the current and the previous Cycle are identical, starting with Lower Highs and now pointing to the exact symmetrical level of April 2020 as the RSI is taking off.
Insane alt season just starting?
-------------------------------------------------------------------------------
** Please LIKE 👍, FOLLOW ✅, SHARE 🙌 and COMMENT ✍ if you enjoy this idea! Also share your ideas and charts in the comments section below! This is best way to keep it relevant, support us, keep the content here free and allow the idea to reach as many people as possible. **
-------------------------------------------------------------------------------
💸💸💸💸💸💸
👇 👇 👇 👇 👇 👇

Looks Like ALTSEASON Is About To Start!By the looks of it Altcoins are going to have a mega partytime starting right about now!
Not financial advice but I would surely would like to have altcoin exposure now.

Alts overview After a bullish january , i do not think that we will have another moon february imo .
For chart perspective , we broke the pannant , but we do have strong double ressitance , the trenline and the ichimoku weekly cloud. That act as a strong resistance for prices .
I think that we will make a fake out and we come back to the pannant eventually , unless we will have a very good news that will make the prices soar in the other direction.
This is not a financial advice , only Ta and Fa opinion.
Thank you

Time for ALTS to decide ? alts has been consolidating for a long period of time now , the market is boring , i think its time for some volatility , BVOL in support , FOMC this week , and we are in December .
i have indicated the zone that the alts would probably target if the decide to go to down/up side ,
this is not a FA .
thank you

Next leg down for ALTSI see that the next leg down for alts would be in the indicated green zone ( this would give us -20% from june lows to -29% ) .
the zone have confluence with HOSODA target for N wave , fib clusters , support zones .
the chart excludes stable coins , btc and eth , just to be precise and to really represent alts .
this is not a financial advice .
thank you

Total 2 potential bottomi think that the bottom of the total 2 would be at 150B , based on HOSODA wave theory and fib levels .
that would give us another 75% fall for ALTS .
not a financial advice .
thank you

ALTS potential bottom the green zone is a potential alts bottom based on HOSODA wave theory and fib levels .
not a financial advice
thank you


ALT Season Is Starting - Total Market Cap 2MartyBoots here. I have been trading for 16 years and I am here to share my ideas with you to help the Crypto space.
This video and chart helps show you ALT Season is about to start.
The ALT Market is in its bottoming phase, be prepared. ALT Season is coming. This is the time when its possible to make life changing money .
Do NOT miss out on this coming bull market
CryptoCheck Team

Altcoin Market Cap: Destined to reach 6 TrillionAlt coin market cap reaching 6T is no longer a dream, its just a matter of time.
In the previous run altcoin marketcap increased from 40B to 1.8T, which is a very significant increase of 45x.
If we see similar run this time, then 45x of 430B will be 19T, even if it reached half of this (9T) then its gonna be a huge win for altcoins. we can expect some coins to hit 100x or even 1000x.
If we look at the MACD, in the last cycle (2020) after the MACD cross market cap increase exponentially, and we are currently seeing MACD getting ready to cross and market is getting ready for bitcoin halving with positive sentiment. Overall we are very confident on MACD cross and altcoin reaching the market cap of 6-9T easily.
Let's wait and watch, give a boost and share your thoughts in the comments.
Cheers
GreenCrypto

TOTAL2The Total 2 chart hit the resistance and on the other hand, it has a pullback to the neckline from the head and shoulders pattern. For now, there is nothing to worry about unless it breaks the neck line down.
As long as it does not go below 600, there is no danger, it is also good ;)

585 -> 770Looking for a pullback to 585. this will satisfy the wick from 7/10 retest, the VPOC is about 572 so that's another target in that range we could see. Once we make that Continuation to 770+ from the ISH seems likely.

Altcoin Market Cap FoundationRecent trends in Altcoin Market Cap indicate a setup for a powerful movement, with a remarkable 90% of altcoins showcasing significant strides since October. This surge is not just numerical; it's embedded in the daily price structure, adorned with robust bullish patterns, notably the Falling Wedge, Triangle, and Triple Bottom.
Since the beginning of October, altcoins have been on substantial movement that haven't gone unnoticed by traders. The market dynamics suggest a palpable shift in sentiment, with a majority of altcoins contributing to the sector's collective momentum.
The daily price structure reveals bullish patterns. Among them, the Falling Wedge is a classic signal of a potential bullish reversal, indicating that despite downward momentum, the market is gearing up for an upward shift. Additionally, Triangles and Triple Bottom formations, known for their bullish implications, further underscore the optimistic sentiment among altcoins.
Key Support Levels:
While the surge is exciting, seasoned traders know the importance of identifying key support levels. In this altcoin rally, the crucial supports to watch are at the $600 billion and $585 billion marks. These levels are pivotal for maintaining the upward trajectory and avoiding significant pullbacks.
Big Target on the Horizon: $1 Trillion Market Cap
As the altcoin market charts an impressive course, the big target on the horizon is the coveted $1 trillion market cap. This ambitious goal represents not just a numerical milestone but a testament to the growing influence and hype of altcoins.
In conclusion, the altcoin market is currently in a position of strength, with momentum building since October. The prevalence of bullish patterns in the daily price structure, coupled with identified support levels and a bold target of $1 trillion, paints a picture of optimism for altcoin enthusiasts and traders alike.

#TOTAL2 is currently testing a crucial S/R level (680b).#TOTAL2 is currently testing a crucial S/R level (680b) on the Weekly TimeFrame.
If you recall , BTC was testing the 31k S/R level a few weeks ago, and once it broke, we witnessed a significant pump.
Now, if there Breakout here as well, We minght see #Altcoins rally.

ALTCOIN CAPI continue to expect a drop in the short term. I had previously made the same prediction for TOTAL. In this process, I predict that the rises in altcoins may be strong profit-taking.
Therefore, there may be a drop until the previous reverse zone. When this place is also lost, the falls will deepen.
As a result, both scenarios shown in green and red are possible. My view is that it will see the reverse zone shown in red.

🚀 Crypto Market Cap (TOTAL 2): Ready for Launch!Excitement is brewing in the crypto sphere as the Total Market Cap of cryptocurrencies (TOTAL 2) signals an imminent surge. All indicators point to a bullish rally, and the chart is painting a compelling picture of an impending breakout. Get ready for a thrilling ride as we navigate the confines of an ascending triangle, gearing up for the third and potentially most explosive retest of the upper boundary.
Chart Analysis: Explosive Potential in TOTAL 2
The chart for TOTAL 2 is currently forming a bullish pattern within the confines of an ascending triangle. This pattern suggests a period of accumulation and anticipation, typically culminating in a breakout to the upside. The impending third retest of the upper boundary is a pivotal moment that could launch the total crypto market cap into unprecedented heights.
Technical Indicators: Aligning for Takeoff
Key technical indicators, including the series of higher lows and the formation of a well-defined ascending triangle, are aligning to create a robust bullish scenario. The repeated testing of the upper boundary serves as a buildup of potential energy, and when released, it could propel TOTAL 2 to new highs.
Trading Strategy: Strategies for the Bullish Surge
For traders, this imminent breakout offers unique opportunities. Positioning for a surge in the total market cap requires a keen eye on key resistance levels, confirmation of the breakout, and swift execution of trading strategies to capitalize on the bullish momentum.
Conclusion: Countdown to Crypto Market Cap Eruption
As we stand on the cusp of a potential breakout, the crypto community is eagerly anticipating the eruption of TOTAL 2. This ascending triangle setup, coupled with the third retest of the upper boundary, hints at a significant upward trajectory. The countdown to launch has begun, and the crypto market is poised for a thrilling ride.
🚀 TOTAL 2 Analysis | 📈 Trading Strategies | 💡 Investor Perspectives
❗See related ideas below❗
Share your thoughts, strategies, and excitement in the comments! Let's ride the crypto wave together. 💚🌐💚

May '22 Inv H&S NL Broke but Alts are Nearing Resistance!Traders,
For the first time in a year and a half, alts have broken above major resistance. This resistance happens to be the neckline for our long-trending inverse head and shoulders. This is hugely bullish!
But before you max out your home equity line of credit, know that we are nearing what looks like it could become a local top. The channel which alts have utilized for almost a whole month to propel them to a breakout is about to hit significant resistance. Once we bump our head here (resistance), I think we'll retest our neckline and then relaunch to our final target.
In addition to being in highly overbought territory on the daily RSI there are more looming threats of a future gov't shutdown. This time I think it happens. Stocks will sharply pull back. Crypto will follow. And everybody will once again have their second chance to buy the fear and re-enter another crypto bull run before it happens.
Stewdamus

Valuating BTC $461,265 & ETH $38,869 in 2024-25 (USD MODEL)
People pricing the market based on "Market Cap" on a new asset class that cannot be valued properly by a "Market Cap" need to check their models, I'm even more convinced something big will happen in 2024 as most Twitter comments (I've read thousands) are waiting for a 2025 (bull market) and think its completely out of the possibilities for the prices I have mentioned.
Cboe and institutions have expressed interest in Ethereum, and it's the only reason why I gave it a second look, even though I think the Ethereum Foundation is clueless. They're not going to be in control of Ethereum once they step in. My theory here is they don't want to pay to recreate a 'blockchain community'; they want to simply outright purchase Ethereum while it's cheap.
The current USDT market cap serves as a great proxy for assessing how much money can move the market. USDT is unique in that it's the only asset to which you can apply a proxy market cap, given its $1 = $1 circulating supply.
$17,362 billion or $17.36 trillion is the amount deposited in commercial banks in the USA. When comparing stable coins to bank deposits, the number varies, being 190-205 times larger than USDT. Yes, this is specific to commercial banking, highlighting that Tether (USDT) is much smaller than what many people perceive as 'real money' in the broader world of finance.
Let's run a simulation: once Spot ETFs are launched, and people participate in futures, it opens the doors for real banking and institutional money to access assets like BTC and ETH. To reach my price targets, a simple 9.85x increase in the money within this asset class is needed.
What does this indicate for the market caps of these assets?
Bitcoin: $9.0 trillion
Ethereum: $4.7 trillion
So, ultimately, Bitcoin will surpass in size, but in terms of performance, Ethereum has a chance to lead.
But is it impossible? Well, how does Bitcoin have a market cap shy of a trillion when there's less than 100 billion in stable coins? Additionally, not all of this is invested in Bitcoin. Indeed, market cap is a terrible metric, we still have retail money that moved Bitcoin by $10,000 on the thought of a Spot ETF approval.
If the Bitcoin spot ETF is approved before January 11, it's going to spark a FOMO rally from institutions, leading to inflows of potentially billions per week, and even billions per day
In addition to this, institutions will launch global marketing campaigns, and there will be daily TV reports on this asset class. Once the Spot ETF door opens to allow flows into this, you better have prepared your positions—I already have.
Larry Fink will talk about these assets but won't do internal & external marketing why?
he slipped up saying "crypto" is a flight to safety in October meaning he has done the same research and decided its go time.
hundreds > thousands ✅ 2010-2012
thousands > millions ✅ 2015-2016
millions > billions ✅ 2017-2019
billions > trillions ❔ 2023-2025

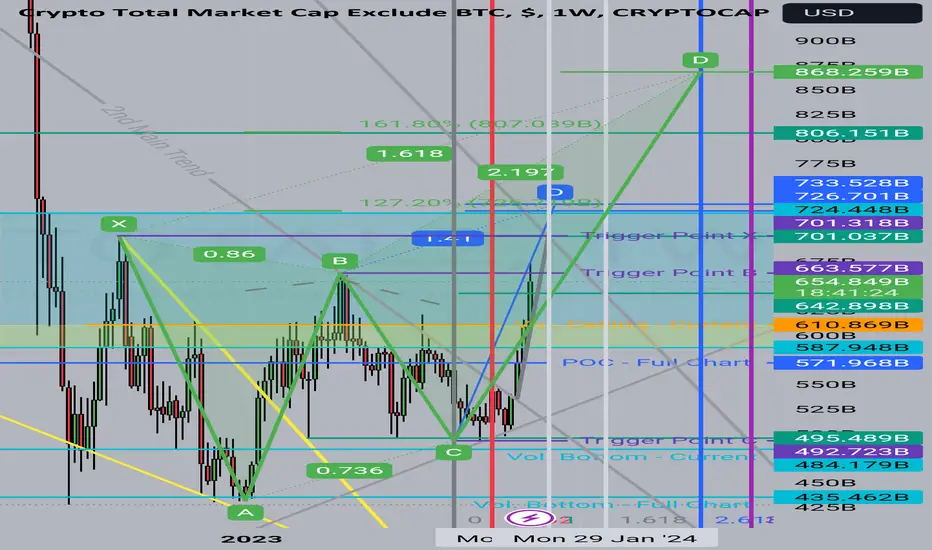
Total 2 on 1W Chart is BullishTotal 2
We have:
abcd model
Crab model
The indicators on the weekly say it is rising, and God knows best, but we need a close above
B to confirm this blue D
X to confirm this green D
If the closing occurs, there is a high probability that we will close above the main trend, God willing
Or we may see a retest on the volume areas
This scenario is currently on the table, but in general the positivity is great, God willing
On 3d and 1d charts, the rise and bump were completed, so we only need to confirm the closure, otherwise we will see a correction like what we mentioned eariler
Time intervals to look at are:
Week of November 27
Week of January 29
All the best insha Allah!
"Analyzing the Total Crypto Market's Breakout and Support Shift"Being a contrarian thinker, I often hold opinions that differ from the mainstream, whether it pertains to stocks or cryptocurrencies. I find myself venturing down an unconventional path, distinct from the majority.
The provided weekly chart depicts the total cryptocurrency market, excluding Bitcoin. Here are some key observations:
Price action has successfully broken free from a resistant trend line that had persisted for two years. This indicates a significant shift in market dynamics.
Furthermore, this former resistance has now transformed into a confirmed support level, a development that underscores the potential for continued positive momentum.
The mention of "10x" likely refers to a significant increase in value attributed to a wedge breakout. Additionally, the term "flag pole" suggests that the market's peak can be projected following the breach of previous resistance levels, akin to the early stages of the 2021 bull market.
However, it's important to exercise caution and remember that this upward trend may not apply uniformly to all alternative tokens (alt-tokens). In contrast to the past, where a broad approach could yield success, the current market demands selectivity. Therefore, it's crucial to make well-informed choices when navigating the market.
Regarding the possibility of further market corrections, while it is technically feasible, it is not deemed likely based on the presented analysis.
In summary, the analysis emphasizes the value of contrarian thinking and suggests a promising outlook for the cryptocurrency market, albeit with a need for discerning and selective investment strategies.
In the daily time frame, the total market capitalization for cryptocurrencies (often referred to as "TOTAL2") is currently in the process of breaking out of a symmetrical triangle pattern. From a technical analysis perspective, this breakout suggests the potential for a 50% rebound in the market's overall value, as dictated by the symmetrical triangle pattern. Symmetrical triangles are typically seen as continuation patterns, and their breakouts often signal the possibility of a significant price movement in the direction of the breakout. Therefore, the current breakout from the symmetrical triangle is being interpreted as a signal that the market's total capitalization may increase by approximately 50%. However, as with any technical analysis, it's important to consider other factors and perform comprehensive research before making trading decisions.
This chart is likely to help you make better trade decisions if it does consider upvoting it.
I would also love to know your charts and views in the comment section.
Thank you

Altseason soon according to ETH/BTCComparing ETH/BTC (left) to TOTAL2 (right)(All cryptos excluding BTC) usually gives us a good idea of when to expect an altseason.
ETH/BTC is right now testing a trendline of support (orange) that has called every low (of the ETH/BTC pair) since 2017.
The gains we have seen from this pair since testing our trendline of support has lead to a 2,044%, 40%, 75%, 103%, and 290% pump respectively.
Also, the RSI for the ETH/BTC pair is oversold on the weekly (bottom green circles). This has historically indicated a phenomenal opportunity to buy.
Taking those key moments from the ETH/BTC chart and plotting them on the TOTAL2 chart shows us that we have seen a significant growth in marketcap after these periods. These moments are indicated with a green arrow in the chart. These periods have lead to a marketcap growth of 82,600%, 28%, 122%, 151%, and 753%.
Looking at our RSI we are at a key resistance level on the weekly (red line) around a 62. If/when we are able to get above we should see a huge growth in the marketcap of many altcoins.
