Get ready for the next Alt SeasonWe are in a critical point at TOTAL2/BTC which is a nice index for recognizung Alt Season.
TOTAL2 trade ideas

Altcoins targeting possible $7 Trillion 2025According to the Beam Band and an Ascending channel along with fractals we could be in for an alarming $7 trillion dollar target in 2025. With the Bitcoin dominance increasing we may still have some sideways chop with accumulation for a while possibly until the 4th quarter of 2024 until the Bitcoin dominance decides to fall back down into the 30% range. For now we still have time to accumulate our favorite projects moving into the 2025 bull run.

$TOTAL 2Since I know there are a lot of Crypto fans out there, and not all of them are CRYPTOCAP:BTC Maxi's. I present to you the wave counts on the CRYPTOCAP:TOTAL2 ( NASDAQ:ALT Chart).
The key with this chart is the counts, but also the fact that the 2nd wave correction lasted 9 candles, and this current correction is at 9 candles (Remember: Each Candle is 3 months!)
So everything seems right, except for one small thing
We are missing one last wave... :0)
Enjoy!

TOTAL2 is About to Explode!The crypto market is abuzz with a significant phenomenon - the shrinking of the total market capitalization, excluding Bitcoin (BTC). Contrary to what one might expect, this contraction often precedes a major pump in the world of cryptocurrencies, signifying the potential for exciting price movements. 🌌💥
Unpacking the Market Cap Contraction
Market cap contraction is a fascinating occurrence, one that hints at the complex dynamics of the cryptocurrency market. When we talk about the total market capitalization excluding Bitcoin, we're essentially looking at the collective value of all cryptocurrencies other than the big BTC.
The Compression Effect: A Precursor to a Pump
Why does contraction matter? It's because, in crypto, this phenomenon frequently acts as a precursor to a "pump," a substantial increase in prices. When the total market capitalization of altcoins starts to shrink within a defined range, it often indicates that the market is preparing for a major move.
Anticipating the Upward Surge
For crypto traders and enthusiasts, keeping an eye on this contraction is vital. It suggests that exciting price surges could be on the horizon for the world of altcoins. Such periods of compression often lead to increased trading activity, resulting in significant price movements.
Trading Strategy: Positioning for the Pump
As this exciting market cap contraction unfolds, cryptocurrency traders should consider crafting trading strategies to harness the potential pump. The market dynamics may offer numerous opportunities to capitalize on these upcoming price surges.
Conclusion: Crypto's Dynamic Landscape
Understanding the nuances of the crypto market is crucial, and the market cap contraction phenomenon is one of its fascinating aspects. As we navigate this period of compression, let's remain vigilant, prepared, and ready to embrace the opportunities that a potential pump can bring.
🚀 Crypto Insights | 💡 Trading Strategies | 💰 Market Analysis
❗See related ideas below❗
Share your thoughts and insights 💚🌐💚

Total 2 (MC excluding BTC) Area Chart confirmed a breakoutMini Altcoin Season is confirmed as we broke above a 8 mo~ resistance and confirmed & flipped the prior resistance into support. This is analyzed through "Area" and not candlestick analysis. Area charts are great to clean up a chart from it's wicks and helps show clear market direction.

When Do alts really start ExplodingThe top chart is Total2 on Weekly, and the bottom chart shows BTC.D.
We can immediately make an observation based on these charts that Total2, i.e. The market cap of all the alts is rising over time and is moving in an upward parallel channel while BTC.D is moving in a descending triangle, which is a bearish pattern.
This tells us that over time the total alts market cap is growing, and they are stealing market cap from BTC.
How can we use this to our advantage?
Using some trendlines we can see what happens to Total2 when the BTC.D tapped the downward sloping trendline, the total2 went parabolic after that.
Using the same trendlines we can project when BTC.D is going to hit the top downward sloping trendline, the chart shows it falls somewhere around December end and first week of Feb.
The BTC.D read at that time should be somewhere around 57 to 58%, this is also in confluence with target from the BTC.D Wyckoff chart I have shared several times past.
The two ellipses in the chart show how I expect BTC.D to move up in the next couple of months.
Also, as evidence here are charts of some of the alts from the previous two bull runs highlighting what happened to them after BTC.D tapped the top trendline. (Which happened on 17th of March and 21st of December.
ETH
ADA
MATIC
There are many others you can look up yourselves.
All this is contingent upon Continuation of BTC Rally beyond 38K in coming couple of months.

📈 Alert! Long-Term Followers & Altcoins vs Bitcoin (ALTSBTC)We are entering a new phase within the current market cycle, we are about to experience something not seen in a long while.
The Altcoins vs Bitcoin (ALTSBTC) pairs are ready to start their growth phase.
This is a major development.
This phase can last between 4-6 months, go really fast and strong and then nothing again for more than two years... It is a very rare opportunity.
There can be some variations though as these things are quite tricky. Market players, market participants, robots can now adapt live to market sentiment, buy & sell orders accumulation, etc.
This market phase is set to start now but it can take another two months to fully develop.
Once it starts going, all the Altcoins will produce a major bullish wave on their BTC pairings, regardless of what is happening in other places. Again, this wave can last up to 6 months. Some pairs will run out of steam much faster while a small few will go for longer.
TOTAL2 is now back above EMA200 weekly as well as EMA21 and EMA10.
We also have a volume breakout and higher lows after a double bottom formation.
I hope you can make the best of this information.
Remember, we are not perfect, there is nothing wrong with making mistakes.
It is better to know that we do err and that's ok.
We learn from mistakes and we grow, we insist and persist and try our best so that each time we can improve, get closer to our desired results.
If something went wrong in the past...
If you made some decisions which you regret; Let it all go...
Learn from it and try again.
We are humans;
Diving living beings and we deserve the best, now and always.
Namaste.

TOTAL2 - Clean BreakoutA strong breakout for the altcoin market cap
A small falling wedge structure within a larger flat type structure.
I expect a bull rally to come.

Alts coin season In November Alts coins have broken out of a weekly downtrend with multiple bullish divergences this can signal the start of a alts coin season all BTC needs to do is hold 28K support and we should rally in the alts coins.
I am calling November to be a very profitable month for alts coins.

we are gonna have a fantastac altcoin partyi think altcoin market cap gonna start a magic bullish run
my opinion : ada to the moon

Not quite there yet...Howdy fellas!
Figured I'd come back and update from the last time I put this chart out there.
I am not playing the bear game here, but if history repeats itself, we still got that big dump before bull run begins.
You might wanna take some profits at the end of this run, as this supposed dump happens in about 9 weeks. Once it starts in drops quick and the move down should be done in 3 weeks.
I can always be wrong friends, so do not run your trades based on my words.
Trade thirsty!

(TOTAL2) Alt coin market cap!!!!!Alt coins are bloody, the market moves based on Demand and Supply
If we go back to our chart, we can see here that there is not much demand in that area, between 600B to 680B.
In our previous data, in that area there was a good upward impulse movement, but now the sellers are more aware.
We can go back to the 400B range of the Alts marketcap, and we can still feel the price drop in some of our altcoins across the market.
be careful when positioning trades on different alt coins. Don't over trade too much. Relax and enjoy different things first to avoid big losses in the market.
PS: 400B support + Moving average 200 ; massive buying zone.
Happy trading!!

Comparing Bear Market Lengths Previous bear market was 798d
Current may not be over yet if assumed same length
The bull shall arrive soon though

#altcoins will have a blood bath?Here' s the #altcoin #totalmarketcap incl. #ethereum . This chart shows , altcoins' market cap have come to the top of the channel. Declination here is will doom altcoin bag holders. Clear breaking channel with volume and weekly closings is the invalidation. I showed the support levels on the chart. The war is not good for markets, a friendly reminder. Always use stop losses. I don' t say buy or sell , always train yourself and this is NOT FINANCIAL ADVICE.

one more dip on Eth.Alts Capbullish divergence forming one more dip can signal the bottom for alts before we move up to alts coin season.

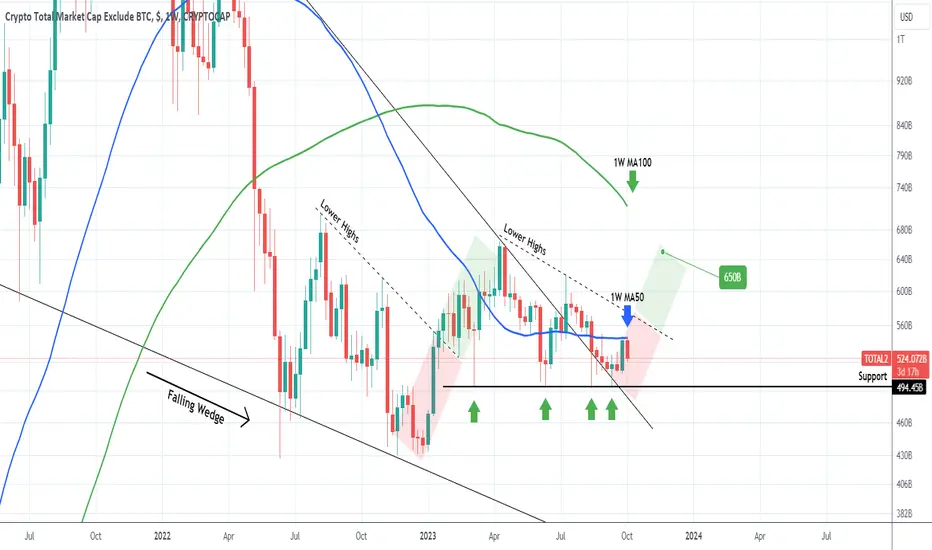
ALT SEASON underway and this Support shows you WHY!Looking at this chart, it becomes more obvious how the alt coin market, which broke this Summer above the Bear Cycle's Falling Wedge, is preparing for a big move upwards. The 494.45 level has been tested 4 times and emphatically held on all as it provided rebounds that left large 1W candle wicks behind.
The latest was on September 11 but stopped last week on the 1W MA50 (blue trend-line). A 1W candle close above it opens the way for a Lower Highs test, similar to January 09 2023, which when it broke it started the 2nd part of the rally.
There is only one long-term Resistance left from the Bear Cycle and that is the 1W MA100 (green trend-line) that is intact since May 09 2022. This what the markets target should be, we estimate a potential contact at 650B, by the end of the year.
-------------------------------------------------------------------------------
** Please LIKE 👍, FOLLOW ✅, SHARE 🙌 and COMMENT ✍ if you enjoy this idea! Also share your ideas and charts in the comments section below! This is best way to keep it relevant, support us, keep the content here free and allow the idea to reach as many people as possible. **
-------------------------------------------------------------------------------
💸💸💸💸💸💸
👇 👇 👇 👇 👇 👇
Altcoins will breath againhistory repeats itself , same waves as previous cycle which again i believe altcoins outperform bitcoin by far percent , covid crash delayed wave 9 play but nothing will stop the trend ,theres a green box which i believe its accumulation zone and be break upside soon enough , lets see how it plays .

Hunting for A Few Altcoin OpportunitiesTraders,
In this video, I am cruising through my altcoin list. These are a few alts that I enjoy trading. We'll look at setup opportunities, technical patterns, and discuss potential entry prices. Hope you enjoy.
Stew

First 30B is in within 9 of days sharing my previous postThere is potential for more as previously mentioned. DYOR.

TOTAL2 - Falling WedgeA large falling wedge structure which is a bullish structure
This will be a break out of a larger long term structure that the falling wedge is encompassed in
The structure on the Weekly is quite flat, we might see Uptober for bitcoin and altcoins.

uptober!!!altcoins really trying to make a break out here, been holding support and needs to make a decision this month. break support or falling wedge

CRYPTO TOTAL 2For a bullish continuation on altcoins, it is necessary to retrace above the broken trend line and then break above the devil number and then confirm as support.
Otherwise, there is a very real possibility of the start of flushing into the sewer.

Alts first plan200B will enter into Total2 within months and we are about to see the first 30B in the upcoming days/weeks.
