Ichimoku for Total 2Crypto Market showing a tendency to breakout with kumo being green & price about to come out of the cloud. Only concern here is the volume. If it comes out from the cloud with a healthy volume, then buy some sh*t coin there is to generate couple of years income.
TOTAL2 trade ideas

Total 2:It came so high because the dominance of Bitcoin dropped a lot, after 565.23 it gives a long position. For its own short position, Bitcoin is better to use altcoin and let it go. I think that because it does not confirm, the elders of Bitcoin give a better short confirmation.

mini alt season?as btc dominance comes into some resistance we could see a little alt season, alt coin market cap is showing the same pattern on the weekly as btc did. big falling wedge with a inverse head and shoulders. we definitely need to hold the 200 week moving average (red line) as long as we can hold 200 wma we are in decent shape for now. the neckline will act as some pretty good resistance.

#TOTAL2 #LQR #TOBTC #LaqiraProtocol TOTAL2 (symbol of all currencies except Bitcoin) In the 1 hour time frame after the strong Break some altcoins were pumped in the 4-hour timeframe, if breaking dynamic resistance and stabilizing the altcoins will create a good position for the growth of altcoins This analysis is not an offer to buy or sell

Total 2:He created a new space, then 557, if Bitcoin Dominance remains bearish, it is the main 562, open a short position below 550 until it goes above 600. Altcoins do not move very strangely, there is no bullring.
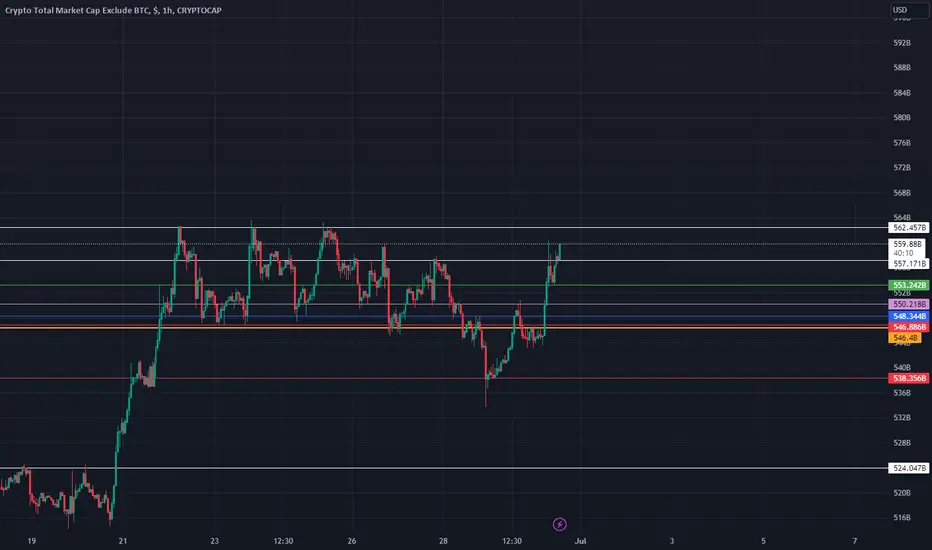
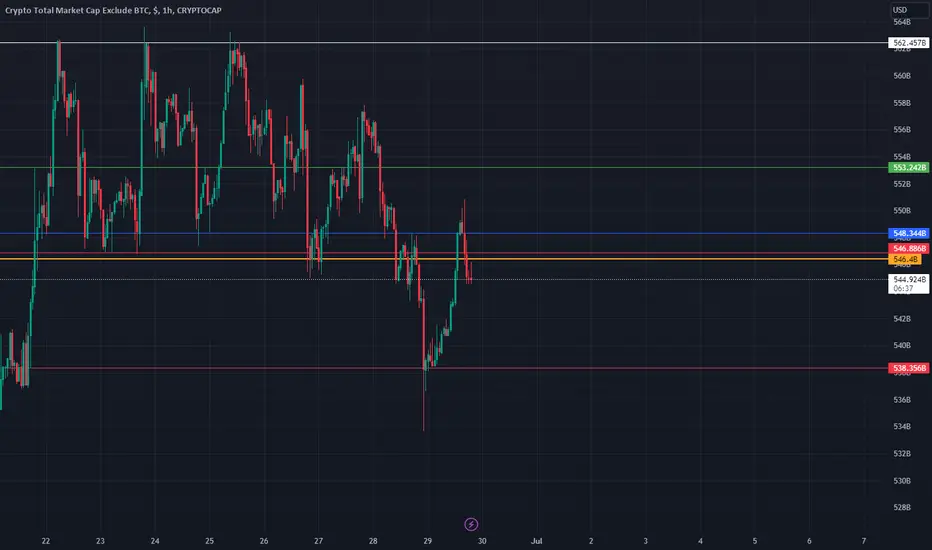
Total 2:546 and we broke it, open a short position below 538 for a long position whenever it closes above 548, then we will analyze.
Total 2:Open a short position below 524, but open below 546 a long way sooner, for the long position, nothing will work for now, even if you want to go earlier, it will not go above 562, because it has to suffer, it will break, I will not enter myself.

TOTAL 2 ANALYSIS (1D)We see a lot of bullish signals on the chart of altcoins and bitcoin, but total2 says something else.
We should keep an eye on this chart because it is a way forward. The red area is really where total2 can go downhill
After the completion of the e wave of the big D wave triangle, we prepare for the descending wave E
The time frame is daily and time consuming


Total 2:Open a long position above 562.941. Open a short position below 554.045. Open a more secure position below 546.

Total 2:562 is an important line, I will wait, close the candle above it, I am going to open a long position on altcoins, open a short position below 546, you want to wait for it to test again on the clock, it is not my strategy, maybe your reaction strategy is effective, I am in the direction I'm trading, I'm not in a position to comment

Crypto Total 3I think we go to the purple area (fib extension 2.618) this cycle for crypto total market cap excluding btc and eth. When can we potentially hit this area? NFA!


Total 2:Open a short position below 546.907, which means the correction of the coins. If the Bitcoin Dominance goes up when the bottom falls, the altcoins will not correct anymore, they will fall. You can go to open a short position on the altcoins. If the coin breaks the shoe, it means start turning green, the altcoins will drop. If one percent drops, the altcoins will drop five percent. It will be risky for a long position above 552.394, but if you want a safe point, form a box after it suffers. Open 562 long positions
After 617, altcoins start to explode

Total 2:Open a short position below 550.469, open a long position above 562.941
For bowlers, it should start above 684. So far, the game is over

TOTAL2 - Daily Inverted H&SInverted head and shoulders structure is completing itself on the daily timeframe for the altcoin market cap (TOTAL2).
The right shoulder has potential to show extremely bullish results as is normal with inverse H&S patterns.

ALT-SEASON or NOT ? ALT-SEASON or NOT ? So how do we understand this? Altseason
To understand this, I checked the whole market by doing very detailed study. I share the charts that I find important on the subject.
The most important charts are:
1-) Btc Dominance
2-)Eth/btc
3-)Eth/usd
4-) Total2, Total3 marketcap
5-)Others dominance
6-)Others marketcap
7-)BTC/USD
8-)XRP/BTC
9-)LTC/BTC
I recommend you to check all charts to fully understand. And thank you
1-) Btc Dominance
First one, btc dom. I dont except impossible levels like 60-70. Looks like we have come to end of the road 🗡 ready >>>waterfall
2-)Eth/btc
The rise of ETH means the rise of altcoins. Strong Eth= strong altcoins
ETH/BTC Most important chart imo. We have to save green line !
3-) ETH/USD
ETH/USD
4-) Total2 marketcap/ exclude btc
Total3 marketcap/ exclude btc and eth
5-)Others marketcap 1w
6-) Others Dominance 1w
7-) BTC(USD
8-) XRP/BTC
9-)LTC/BTC
Conclusion : I think the real rise of altcoins will be in 2024. This does not mean that we will not see any increase in 2023. But my main strategy is to collect in 2023 and sell at the end of 2024.
These charts are more meaningful when they come together and form a whole.

TOTAL2 LONG IdeaWe can see a clear Inverse Head & Shoulder Pattern that broke up, the long target is just at MA200 in 4hours chart. We should wait for retest confirmation to open long positions on Altcoins. Remember to manage your risk and Use stop lost in all your positions. I will update this Idea later.

TOTAL2After the 5 of C wave ends, I expect the price to rise. This descending wave is very valuable. I find it appropriate to buy in steps.

Total 2:If Bitcoin Dominance was not bullish, Total would definitely break 524, but if it breaks 524, it is a good confirmation for opening a long position, below 514 will confirm short position, but if you want to use Bitcoin, get confirmation from Total below 517.

Total 2:Because Bitcoin's dominance is upward, so we have to find a more reliable entry on the total, but the earlier entry is 524.187 for a long position, for a short position below 514.851
If bitcoin breaks sooner, I will open a short position sooner


Total 2:Open a short position below 500, open a long position after 513, focus more on Metaverse coins, but with capital and risk management.
