TOTAL2: brighter days for altcoinsJust by simple support lines (those are showing previous ATH) and trend line, we can see that TOTAL2 (market cap without BTC) is in very important zone.
We need to watch this zone and ask question:
Is altcoin bull market coming?
TOTAL2 trade ideas

Total 2:It fell because Ethereum fell a lot, the rest of the coins also fell, but Ethereum fell a lot, and the entry point for the short position was also missed. Even if Total 3 falls, altcoins will fall another 50-60%, so it has important support ahead.
There is a lot of fear in the market, so it moves faster than failures
Open a short position below 500

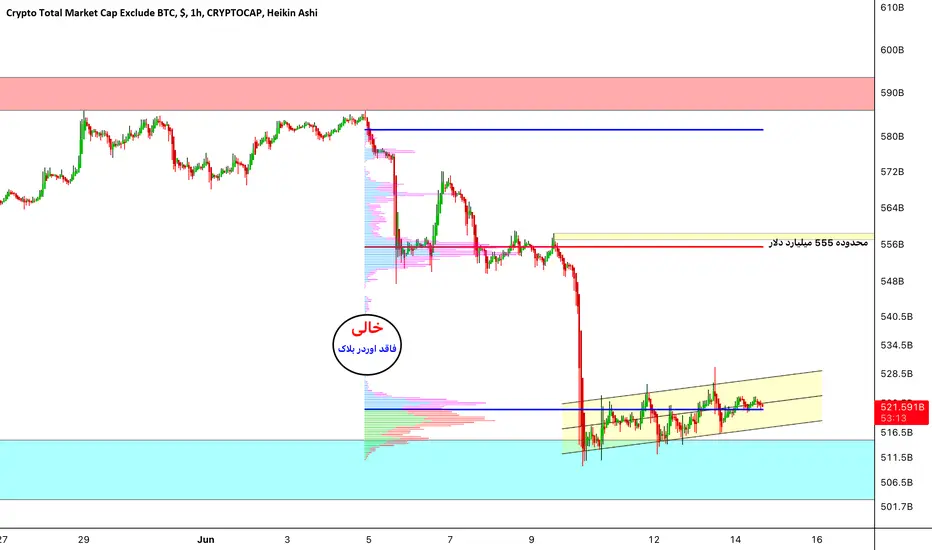
DestinyIf Aker breaks the yellow channel from the bottom, he will enter the time correction because the daily support of the static box is blue phosphorus, and if he hits the yellow channel from above, it will grow to the range of 555 billion dollars.
Total 2:After 523.892 confirmation of the long position, it will give you a short position below 513.567

total2 proyectionthis is my pov about the total2. Here is the eth pain with other altcoins but what you can see here is that we will have cheap eth soon between september and december 2023.

TOTAL2 - Looking at the RSIDrawing channels on the RSI shows that we are nearly due for another up tick
This is the total market cap chart, TOTAL2
Weekly timeframe

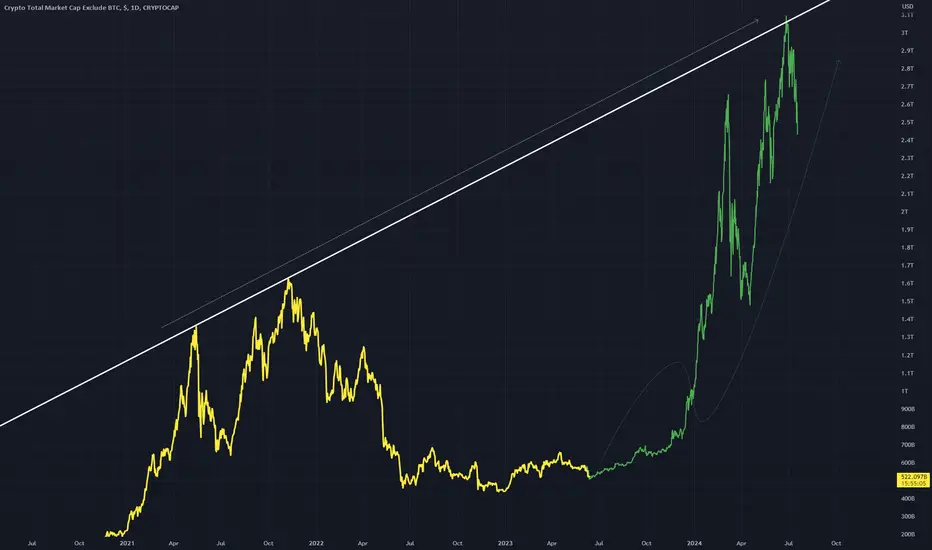
TOTAL2 - Higher High Trend LineDrawing a trend line along the higher high that formed in prior bullrun puts forecasted MCAP at about 3T
The bars pattern might be a bit off but this is a massive move regardless.
BULLISH
Total 2:There are good candles in four hours, two of them are flat, we can take a long position out of it, so Bitcoin dominance is also suffering, so find bullish Bitcoin as long as Bitcoin dominance is bullish, I will not collect altcoins myself. But, well, this is me, you have to analyze it yourself, in fifteen minutes, it will confirm after 523, for long position below 513, it will confirm, for short position, don't open earlier, it's all 4% more, so when you are not sure, let it go, save your head.

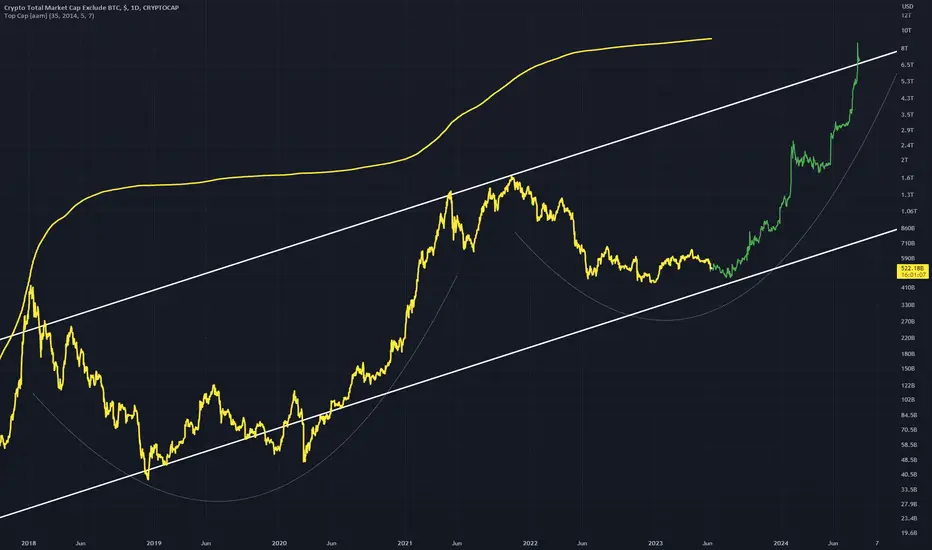
TOTAL2 IdeaIn idea showing a large up move on the market cap chart
I don't think the current market cap is appropriate at all. We are yet to see the top.
The yellow line shows top points, with the last top being hit in 2017.
The last bull run in my mind was a sort of quasi bull run, leading to the one we are about to see.
Altcoins' Downturn & Bitcoin's Unmatched SupremacyLet's cut to the chase. As an advanced analyst, I see a cataclysmic drop in altcoins on the horizon (obviously). This isn't just a hunch; my trusted charts reveal a looming dive to super low levels. Even stable-coins like tether, which often a safe haven, are part of this story, affecting the Total2 index. Stable coins make up about 120 billion dollars (20% of Total2) as of June 13, 2023.
But don't worry! Bitcoin stands tall amidst this chaos. It's the clear leader, shining in technical prowess and visuals. Altcoins, in comparison, are garbage securities which just don't measure up.
As altcoins lose steam and get sued to zero, I see money moving back into Bitcoin, further solidifying its top spot. In short, brace for an altcoin shake-up, stay prepared, and always trust the charts. Especially mine. Not these SCAM ARTISTS who know ASBOLUTELY NOTHING about financial markets.
See my inverse - Bullish Bitcoin idea linked below...

Expanded Flat -> Triple-BottomTotal2 looks like an expanded flat completing its reversal at the end of a C wave.
It has twice bottomed just shy of the 1.618 for its trend-based fib, and may or may not reach a 3rd bottom near this area before exiting above its neckline.
If it doesn't reach bottom again, it's possible it could perform a move similar to what INDEX:BTCUSD did here:
However, it has so far failed to maintain a breakout if we draw a similar wedge on Total2:
A 1x measured target lines up with its 50% trend-based fib, while the 2x measured target for the triple-bottom lines up exactly with its 0% fib, exactly where total2 reached its ATH.
This would go in line with my theory that movements in DXY could lead to recoveries across multiple markets that end in double-tops.

Pullback and growth for the Total2According to the breakdown of the descending channel and its high stabilization, it can pullback the breaking level and then maybe we will have a suitable growth.

Total 2 - Altcoins minus BTC TOTAL 2 - Crypto Market Cap minus BTC
Three confirmations for bull status
1. Above 100 week SMA (No where close)
2. Complete 149 weeks in Pennant (Dec 2023)
3. Break above Point of Control (POC)
The 2018 - 2020 fractal is overlaid for perspective only
The Point of Control (POC) is the price level at which the greatest number of contracts have been traded within a volume profile (THICK RED LINE).
This line naturally coincides with resistance overhead.
Its important to recognize that the chart is just a perspective that aims at helping with timing an entry with a good potential outcome. With three indicators backing your trade you would have a better probability outcome. So we wait for the three confirmations to occur. Could you be accumulating sure.... but why would you when we are under the 100 week SMA appear to have more time to burn before a Bitcoin cycle really kicks off never mind the altcoins. Its important to recognize also that this chart includes ETH and ETH has been performing exceptionally well this cycle. I will be completing another chart excluding eth in coming days.
I hope this chart helps you time your trade and your positing into altcoins, when the time is right, when we have confirmations and the wind at our back.
PUKA

Important levels and dates for $altcoinsStill think we'll see one push higher before the continuation of the bear market, however, alts may have a capitulation move first.
If we look at Total2, we can see that $484B never got retested as support. So it would make sense that price action would need to test that level before a continuation higher. If it does get hit and bounces off that level, you can see the chart would form an inverse head and shoulders pattern.
I could see a large bounce higher happening after to tag one of the higher two resistances (I lean towards the $800B one).
Let's see if this plays out in the coming months. It looks like this would all need to play out before August.

BTC 20% pump incoming ?!! BTC anaylsis today 💎 Observing yet another correction in the bullish trend, closely following the Ascending line 👀
💎 The price is poised to rebound from the supportive cluster of MA 50 and Ascending line.
💎 Paradisers, it's time to adopt a bullish stance once the bounce is confirmed 📈
💎 Remember, in the fast-paced world of crypto, timing is everything. Stay tuned for more updates and happy trading!

UNI 22% upside incoming ?!! 💎 #Uni has shattered its long-standing support level and the lower limit of a triangle formation, indicating a likely extension of the bearish trend 📉
However, there's a crucial element to take into account. The price discovered support on the descending trend line, coupled with a bullish divergence on the MACD indicator, hinting at a possible rebound 🔼
We're looking at two potential scenarios:
1️⃣ A consistent drop following the breach of the last low
2️⃣ A pullback to the trend line prior to recommencing the downward trajectory
Remember, ParadiseFamilyVIPs, in the ever-evolving crypto landscape, staying informed and adaptable is key. Stay tuned for more updates and happy trading!

DestinyBy observing the stop loss and according to the support between the coins, the probability of TOTAL2 growth is very high considering the harmonic pattern

TOTAL2 Structural Similarities Early point in TOTAl2 evolution is showing similarities to the structure that is forming now on TOTAL2
This may be an indicator that market cap is going to go ballistic like it did in early 2016
Lets see what happens.

TOTAL2 Altcoin Marketcap /This time is different !TOTAL2 Altcoin Marketcap /This time is different, isnt it ?
-350days SMA
-700days SMA (2x)
-1050days SMA (3x)
-1400days SMA (4x)
'' 1-2-3-4-5 ''
Different way but same story

long longFind and buy the best altcoins when it's time for the big pump
i promisse it will happend
follow me and enjoy analysis and take good profit


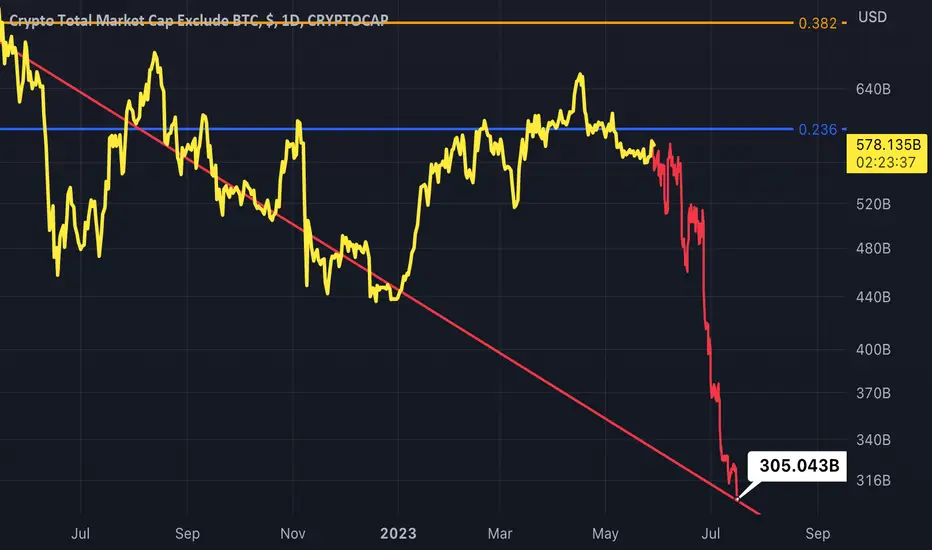
TOTAL2 - Rejection at .236A bearish idea for TOTAL2 showing a rejection at .236 fib
This allows another trend line to be completed at the same time
Market cap would drop to about 300B as shown with the price label