This One Chart is Key for Altcoins!Traders,
It's simple. The Altcoin Market is currently preforming a classic re-test of previous resistance (now support) at the inverse H&S neckline:
- If it holds, Alts are safe for the moment and will continue upwards short term.
- If it breaks, the inverse H&S pattern becomes invalidated and alts have further drawback ahead.
Keep a close eye on this chart.
Stew
TOTAL2 trade ideas

Total 2 - will go down!Dear All,
I believe we are going down once again!
Maybe it is last wave...
Best Regards
Brando

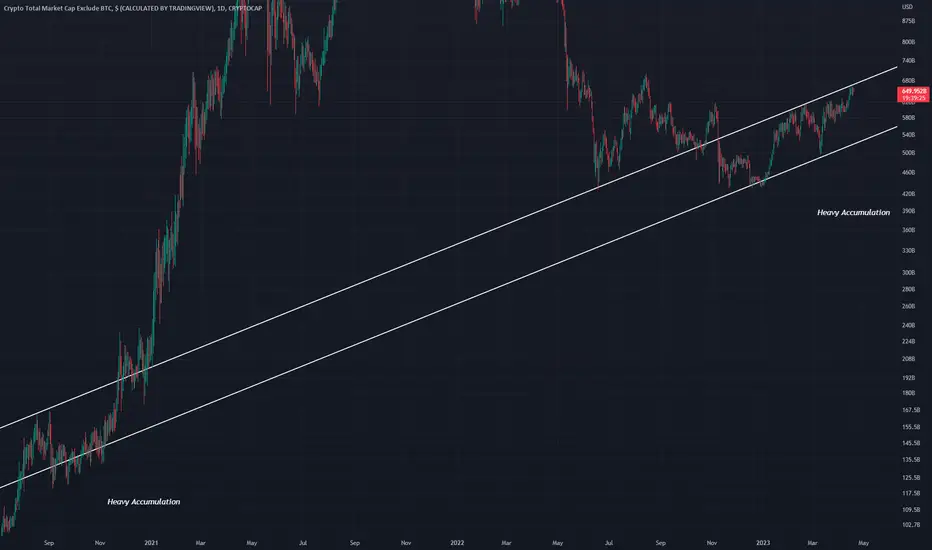
TOTAL2 Similar Price EventsHeavy accumulation is evident in these areas
A roll over top followed by strong movement is characteristic of the two
Right now the second one is just breaking out, as did the first in spectacular fashion
Bullish
Altcoins marketcap to hit $5.755T? Previously, altcoins formed a W pattern in 63 bars / 1124 days.
13 bars / 91 days before it hit new ATH.
Retrace, then created another new ATH and altcoins cycle ends.
If it repeats this, then I'm expecting Dec 2024 to retest ATH / 1.707T.
Jan 2025 - March 10, 2025, as possible pullback.
April to September 2025 as the final peak at estimated 5.755T marketcap.
Let's see.
Trade cautiously. Ingat!

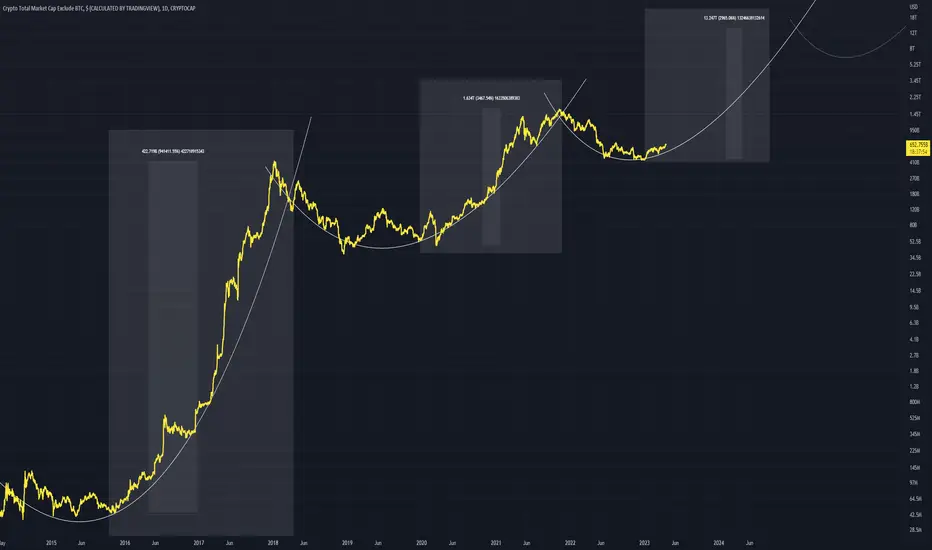
TOTAL2 Curved Trend The trend that will take us in to the next bull run
This curve is evident since the start of price formation. I have put an extra dotted line to show what it would look like if the curved trend repeated again.
There is a massive difference however in % between the first being (941411%) and the second only being (3500%)
Bullish heading into the third curve up
TOTAL2 - Finding Its Altitude First Bull run -> 420B
Second Bull Run -> 1.6T
Third Bull Run - ?
These curves each show the journeys to the moon, it looks as if the curve pattern repeats.
I have made a post like this in the past linking it below
This is the altcoin market cap

ALTCOINS are bullish - TOTAL2 with weekly bullish divergencesAltcoin market with a weekly bullish divergence looks bullish overall and we expect the uptrend continuation in the mid-term.
We are not looking for shorts now.
When we get a pullback, it's a buy the dip opportunity.
How deep the pullback can be? The price may retest the key support again but most likely it will create a higher low and confirm its bullishness . Breaking (and closing below) the key support would be an invalidation of this trading idea.

alt season or what?the growth on the chart is more likley and since the btc.d is bearish now we can expect that alts pump one after another

Altseason 2023 is going to start in coming days. Be ready. Hi dear community and my lovely followers.
I will be in short. I want you to inform that be ready for Altseason 2023 which is going to start in coming days. It will be wild.
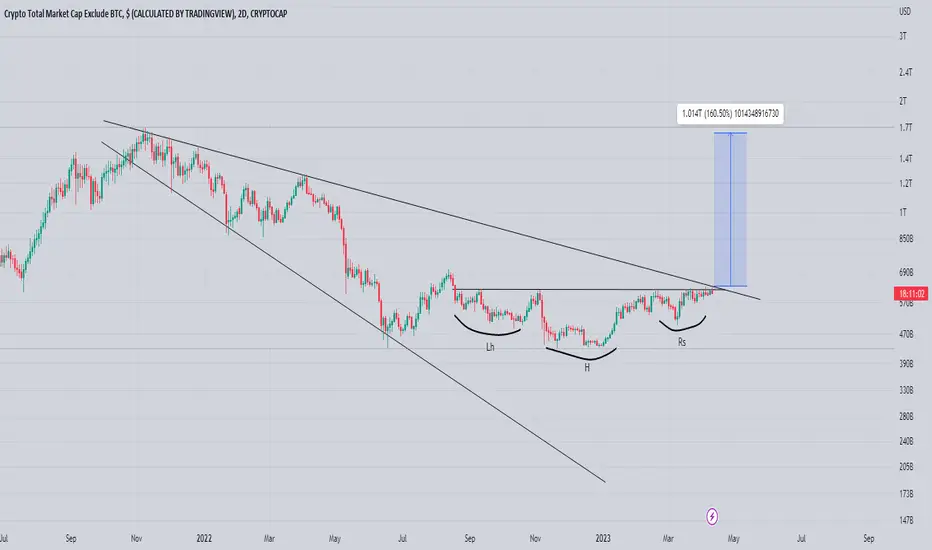
As you see Total 2 on weekly log chart has broken the main diagonal resistance/ weekly falling wedge/ and it is going to break pink zone which is one of the strongest horizontal resistance.
As soon as it will be flipped, All altcoins will explode in a crazy way making x5-x10. Bellow you can see also Total 2 weekly regular chart, where Descending triangle was broken and retested successfully. The only thing we need is "flip the main horizontal resistance and the party will start.
Also pay attention to Weekly RSI which has also broken the main diagonal resistance with retest and it is above 50 level, so huge momentum is coming to altcoins market)))
BTW BTCD hit 48% main resistance which is again sign that it will be rejected because of altcoins hard pump.
Pay attention to updates bellow this analysis I'm going to post other charts as well.
Don't forget to like, comment and follow please. I'll appreciate your support.

Is Crypto Alt Season ComingCrypto Market Getting Ready For Massive Alt Season Market Cap Trying To Clear Inverted H&s + Descending Wedge Once These Patterns Got Cleared While Lots Of Alts Breaking Out Rally will Be Massive
Keep Some Good Projects Under Radar For breakouts
When should you trade ALTs? Here's the level to watch:The market cap of Altcoins is currently facing a significant challenge in surpassing the HKEX:630 billion benchmark. However, a notable surge in Altcoin activity is expected once this level is breached. Notably, the current BTC dominance of 48% can be attributed to the fact that most ALTs have broken their BTC-pair support. Consequently, if BTC experiences a downturn, the ALTs will likely be adversely affected since they have limited support!
Therefore, it would be prudent to closely monitor the $630B mark if you are considering trading ALTs. A breach of this level could signal a favorable opportunity to enter the market. Still, it is crucial to stay vigilant and manage your risk accordingly, given the current market dynamics.
-------------------------------------------
Recent Altcoin trades:
ARB / USDT: 5% profit
DOGE / USDT: 20% profit
XRP / USDT: 9% profit
-------------------------------------------
Ongoing trades to keep an eye on:
DOGE / USDT: TP1 met and still going
XRP / USDT: TP2 met and still going
-------------------------------------------
If you like the content, then make sure to comment and like the post :D
Follow me for daily profitable trading setups.
BTC dictates the market. If BTC falls, then Alts will drop as well. Trade safe!

Neckline Breakout on Total2 (Altcoin Market Chart)Traders,
We have a break on out Altcoin Chart but before we get too excited, let's wait and see where today's candle closes. We are hoping for a close today above HKEX:608 billion. Once confirmed, it becomes safer to step on the gas pedal in the altcoin market, though, preferably, we want to see another candle open and close above that neckline tomorrow as well.
Best,
Stew


Total 2 showing weaknessHere is the possible scenario for Total 2 in upcoming weeks…Inability to break out of the range high and increased sell pressure at this region with hunting wicks to take out short positions, I think this scenario is likely to happen…Considering the fact that TOTAL1 itself hasn’t been able to break out of the top of the range (in related ideas) and showing weakness in that area gives me more clues on where the crypto market is heading in mid-term.
Lets see if its gonna play out…always a student.
#TOTAL2 | Alts and Bitcoin dominance update!- as long as we are under 620 B, we are going to 550B level
- most likely, bitcoin dominance is going to test 47.65% level and that mean the money will flow from alts to bitcoin to hold the price a bit and prevent Bitcoin from going down hard.
- that mean Alts is going to have a correction (-5 to -10%) but that doesn't mean you should sell your alts.
- in my opinion, this correction is healthy and not dangerous as long as bitcoin doesn't show any negative price action or reversal pattern.
- I advice to just rebalance your short term trading wallet and prepare to buy more alts as there is still a pulish momentum in alts in general.
Take care everyone and thank you 🌹

TOTAL2 Elliott Waves Analysis (altcoins)Hello friends.
Please support my work by clicking the LIKE button👍(If you liked). Also i will appreciate for ur activity. Thank you!
Everything on the chart.
Looks like we got upward impulse and correction in form of flat (3-3-5)
Waiting for continuation of growth with main target zone 700-750B.
Cancellation of scenario - 500B
Good luck everyone!
Follow me on TRADINGView, if you don't want to miss my next analysis or signals.
It's not financial advice.
Dont Forget, always make your own research before to trade my ideas!
Open to any questions and suggestions.

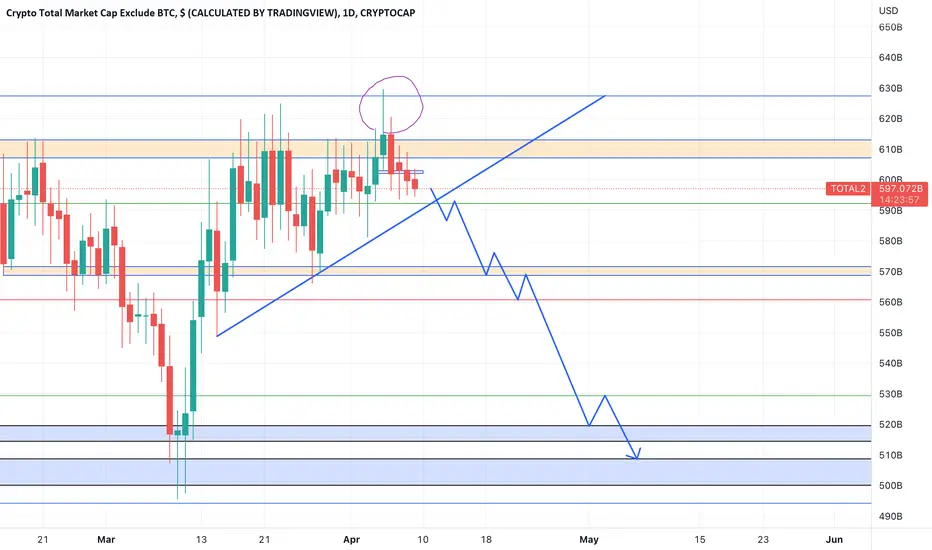
04/04 Journal: TOTAL204/04
~ watching to see if PA can flip local res and run for highs, or if 617B remains ceiling for now.
Rejection bearish for ALTs

When should you trade ALTs? Here's the level to watch:The market cap of Altcoins is currently facing a significant challenge in surpassing the $620 billion benchmark. However, once this level is breached, a notable surge in Altcoin activity is expected. It is worth noting that the current BTC dominance of 47% can be attributed to the fact that the majority of ALTs have broken their BTC-pair support. Consequently, if BTC experiences a downturn, the ALTs will likely be adversely affected since they have limited support!
Therefore, it would be prudent to closely monitor the $620B mark if you are considering trading ALTs. A breach of this level could signal a favorable opportunity to enter the market. Still, it is crucial to stay vigilant and manage your risk accordingly, given the current market dynamics.
-------------------------------------------
With regards to BTC:
the zone between 29k to 30k is a critically important price range that requires close attention. It has played a pivotal role in differentiating between the bull and bear market. As soon as the price broke below this zone, the market was deemed to have entered a bear market, while staying above it signaled a continuation of the bullish trend .
Currently, the price is once again testing this critical zone, and its behavior here will be a determining factor for the market's future trajectory. A hard rejection from this level could result in a sharp decline in price, while a breakthrough could propel the price upwards to the range of 40k to 47k . Thus, investors and traders alike should closely monitor the price action around this zone to make informed decisions regarding their investments.
But the weakening trend and Fair Value Gap on multiple time frames point towards a downward move!
-------------------------------------------
If you like the content, then make sure to comment and like the post :D
Follow me for daily profitable trading setups.
BTC dictates the market. If BTC falls, then Alts will drop as well. Trade safe!

TOTAL2 - Crypto m. cap excluding BTCThe Altcoin market cap is struggling to break the $620B mark. If breached, expect a surge in Altcoin activity. But remember, Altcoin performance is closely tied to BTC, so a dip in BTC price will hurt Altcoins too.
Keep an eye on the $620B mark if you're looking to trade some ALTs
-------------------------------------------
If you like the content, then make sure to comment and like the post :D
Follow me for daily profitable trading setups.
BTC dictates the market. If BTC falls, then Alts will drop as well. Trade safe!

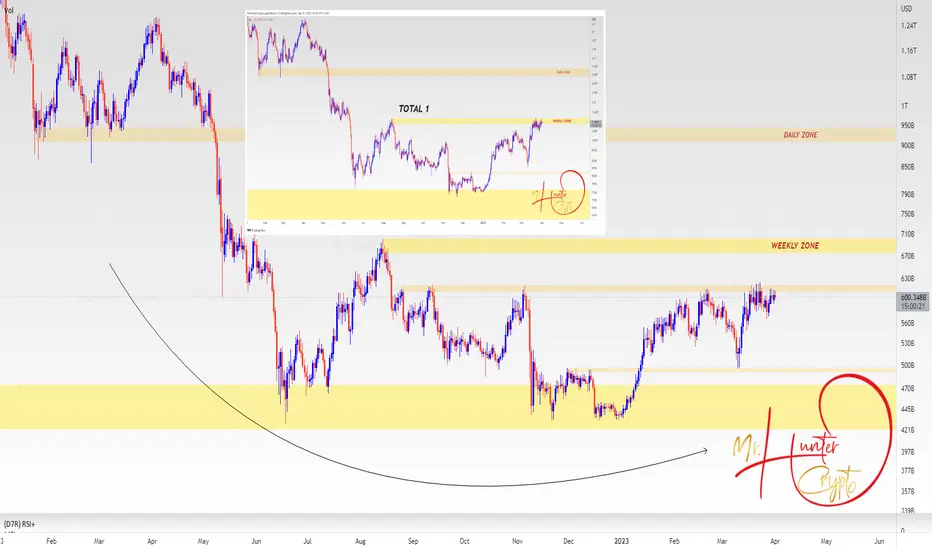
TOTAL2The Total 1 index, which indicates the total value of the crypto market, has reached its weekly resistance, as shown in the picture, while the Total 2 index, which indicates the value of the crypto market minus the market value of Bitcoin (i.e. Ethereum and others), has not yet reached its weekly resistance. This is an indication of the survival of altcoins compared to Bitcoin. In the previous analysis, possible scenarios were presented with regard to the dominance of Bitcoin, which should be seen if this survival will be compensated or if the reason for this is simply that the market is less favorable to altcoins compared to Bitcoin. It is also logical
Monthly close - Is Alt Season on its Way?Bulish on Alt Coins
Why:
- MACD Bullish divergence
- Increasing Volume
- Retracement of the previous Bull Run at Peak
- Bullish Monthly Candle
- BTC Dominance (BTC.D) at Resistance, expecting a retest on the previous regional High
Secondary Reasons:
- Overall Bullish Monthly Close of Macromarkets (NASDAQ & S&P500)
- BTC bullish
Feel free to comment on my Idea and let me know what your opinion is.
No financial advice.

total 2 weeks charttotal 2 shows the status of altcoins as you know
There are 2 tobo formations in total, which means the start of the bull season for altcoins.
it looks like altcoin season will start if the usa doesn't unnecessarily sue someone again
I hope the graphic works

Total ALTCOINS Market Cap Excluding BTCWith everything in the crypto space haven plummeted more that 85-90%, it has been one of the longest crypto winters since the emergence of Mainstream Blockchain technology. With most of the indicators signaling the start of a bull market, with the next bitcoin halving just a year away, and technically from the chart, we might be on to an altcoin season....Brace up!!!
