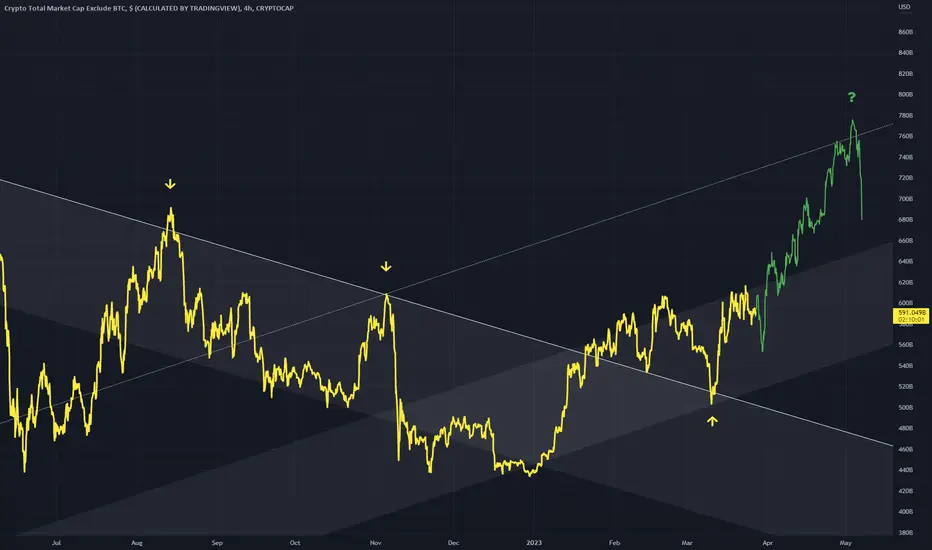
TOTAL2 - Bull Continuation4Hr chart for the altcoin MarketCap (TOTAL2)
Some important channels to be considered, and a potential rise to the diagonal dotted line
This will be the smaller rally before larger one building
TOTAL2 trade ideas
Altcoins getting ready to pop!Traders,
Check out this inverse H&S pattern spotted on TOTAL2. Looks like altcoins might be preparing for a bit of a pop here soon.
Stay tuned to this!
Stew

Altcoins channel cross⭐️Altcoins channel cross⭐️occurred in November
We are now in the gray accumulation phase
When we see a close above the channel we will be in the pre-bull run phase until the next cross⭐️leads us into the main bull run phase
RT & Follow appreciated dear Crypto Nation🤗
Let me know your thoughts in the comments🤗
⬇️⬇️⬇️
Likes and Follow for updates appreciated🤗
Disclaimer:
Not financial advice
Do your own research before investing
The content shared is for educational purposes only and is my personal opinion

Crypto Consolidation then BreakoutI think it would look something like this.
Look, we have some nice fibs. We have a nice bullish pennant. Support lines, resistance lines.
Now all we need is for reality to catch up!

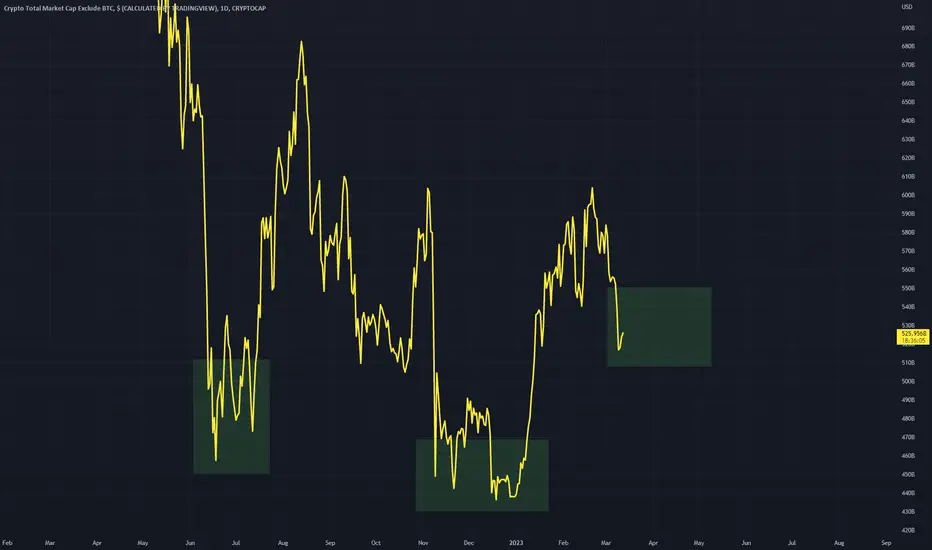
2023 ECHO BUBBLE ALT STRATEGY 2/4: TOTAL 2 CLEAR YELLOW RANGEIF BTC Dominance flips (part 1/4), then total 2 should be looked at next
Look for Total 2 to clear this yellow resistance zone for confirmation to further look into alts

Alt Market on the VergeThe alt coin market is on the verge of a potentially volatile move, with several interesting factors at play. The recent candle close above the 0.5 Fib fan, which has acted as resistance, now appears to be holding as support, signaling that something significant may be stirring
However, the most critical chart to watch right now is the Bitcoin market cap dominance. In the past, whenever the RSI poked outside the 70 zone, it signaled a bottom for the alt coin market. Last week's close put us just past that 70 zone, and it took 91 days for the dominance to come back down to the range. During that time, the alt coin market moved $285 billion and $255 billion dollars. Therefore, a move of $250-300 billion from where we are now could put the market cap at around the 0.382 Fib and under the 0.75 Fib fan.
This is one of many reasons why I believe the top for the market will be in late June 2023. I use Fib time sequences frequently with great success, as we caught the big move down in the market months before it happened last year. We plan to do the same this year.
So, when will this move happen? For me, it's straightforward. Once we break the support on the USDT dominance, we will see the next and possibly final leg of this relief rally. The entire year, we have failed to break this level, which shows very strong support. However, I am confident that a break of this level will signal the start of the next significant wave up for the market.
There is alot of money to be made in the next 90days its going to be a easy x2-5 on most alt coins the move is going to be volatile , greed will come into the market heavily but come late June 2023 it will be over so there is very limited time to take advantage before the next big crash.

The alt-token market is about to boom - wave 5On the above 3-day chart alt-token market dominance is testing resistance for the 3rd time (although technically speaking it is the 5th test if the two tests in January 2018 are counted). We all remember what happened to our alt positions in May and September is probably still fresh in our minds, a strong sell off.
The 60% dominance level (blue line) represents almost 4 years of resistance. Once broken, it will result in a huge amount of capital flowing into alt-token projects, excluding those already overbought.
Wave 5? To understand what I mean you’ll have to look up an older idea published last December:
tinyurl.com
Suffice to say the alt-token market dominance in this bull market cycle has comprised of several moves in accordance with Elliot wave theory. This 5th and final wave should bring alt-token market dominance to approximately 90%, as per this idea:
When will it get there? No idea, however I’m leaning towards the 2nd quarter of 2022.
The 5th and final wave will be explosive and euphoric. A hideous bear market will follow. Make the most of it.
Good luck.
WW

TOTAL2 - Altcoin market cap can't break 620B!Here's a quick look at the total Crypto m—cap excluding BTC.
It is evident that the total market cap of Altcoins is currently encountering challenges in surpassing the $620 billion threshold. In the event that the market breaches this level, a significant uptick in Altcoin activity is expected to occur. However, the performance of Altcoins is intrinsically linked to that of BTC, such that a decline in BTC price will negatively impact Altcoins. Moreover, any decision by the Federal Reserve to increase interest rates by 50 basis points would likely result in a considerable market downturn. As such, it would be advisable to closely monitor the outcome of the upcoming FOMC meeting tomorrow.
-------------------------------------------
Key Dates to Watch in March:
21/22 Mar: FOMC Meeting
30 Mar: GDP Report
-------------------------------------------
If you like the content, then make sure to comment and like the post :D
Follow me for daily profitable trading setups.
BTC dictates the market. If BTC falls, then Alts will drop as well. Trade safe!


Total 2 with many resisdance on the way upchart is clear, Daily resistance from the 2021 top, It's virgin, first touch. onething more a strong static resistance is here, I expect a correction from here

Alt-coin market dominance to 75%This is amazing. Been waiting patiently for confirmation before publishing. We now have confirmation.
On the above 1-day chart alt-coin dominance breaks out of the falling wedge, corrects, then backtests past resistance as support. That was confirmation.
A measured move from the flagpole informs us dominance will rise to 75%. This is significant. Why? The altcoin market dominance has NEVER been this high before. In the bull market of 2017 it topped out at 65%.
The gains in the next 6-12 weeks in alt-coins will be life changing if you let them become that. Gains are easy. Taking profits is 99% difficult. Ask me below in a future post if you’re unsure about your alt-coin.
Remember the gains at 75% dominance will exceed those you saw on your alt coin in 2017. Emotions are a money killer. The majority of folks that bought into the market in at the end of 2017 were left behind. You’ll be selling, not buying by this time - please remember that!
See you on the other side.
WW

ALT M.CAP IS AT RESISTANCE! RISKY TO LONG ALTS HERE!!Hello everyone, if you like the idea, do not forget to support it with a like and follow.
Welcome to this TOTAL2 aka ALT MARKET CAP update.
TOTAL2 is forming a channel in daily time frame and currently hovering below the resistance line. We need a clear breakout of this resistance line to go long in Alts. Longing anything at resistance is more risky.
BTC is also entered into the resistance zone of $28k-$30k level. From here we might see a decent pullback in the market. Also, we have an FOMC meeting this week.
All these scenarios make this week more interesting and crucial. Don't buy anything here either wait for a pullback or wait for the clear breakout.
If you like this idea then do support it with like and follow.
Also, share your views in the comment section.
Thank You!

NEXT Rally for ALTS ! We broke and close above last HL, came back and retest it and made LH ===> change of market structure.
If we can close above the resistence we will see a nice rally for $ALTS ! <3

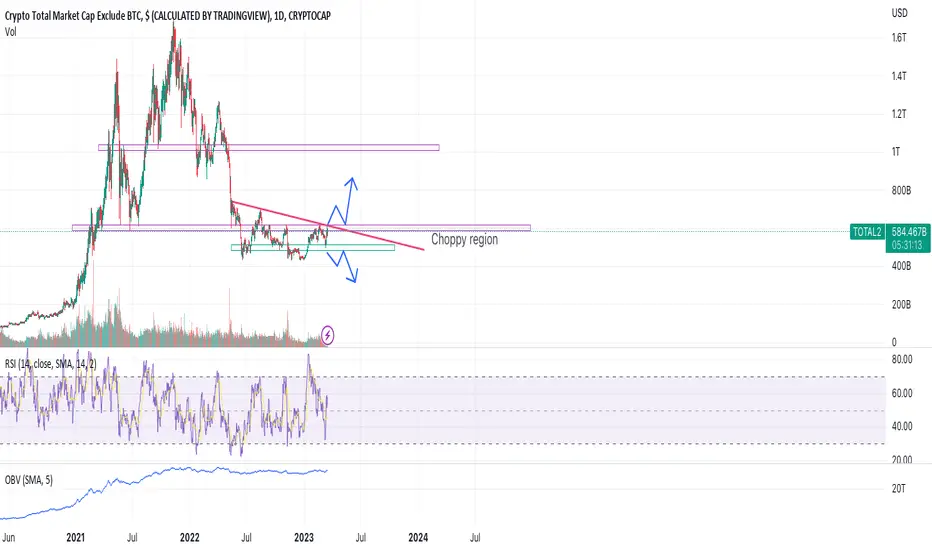
Choppy region for your favourite altsWhile world collapsing, bitcoin shows the strength. People remembered why BTC has invented! Total market cap for altcoins are at the resistance point. If we break this resistance we may see green rockets as we saw in the old days. Otherwise choppy session will continue. Let's pray we don't break down the green support zone.
Disclaimer – WhaleGambit. Please be reminded – you alone are responsible for your trading – both gains and losses. There is a very high degree of risk involved in trading. The technical analysis , like all indicators, strategies, columns, articles and other features accessible on/though this site is for informational purposes only and should not be construed as investment advice by you. Your use of the technical analysis , as would also your use of all mentioned indicators, strategies, columns, articles and all other features, is entirely at your own risk and it is your sole responsibility to evaluate the accuracy, completeness and usefulness (including suitability) of the information. You should assess the risk of any trade with your financial adviser and make your own independent decision(s) regarding any tradable products which may be the subject matter of the technical analysis or any of the said indicators, strategies, columns, articles and all other features.
KEY support for Crypto BullsAltcap (TOTAL2) is retesting the upward green TL, the blue channel, and has completed an a=c retrace. Great longside R/R here and key support for any further wave up in this manic move!

Total2 update...Imagine the smell of support on the supply zone...
Means a big Altcoin season coming up, when this happens...

CYCLES within Cyclesorange line is BTC market cap
Blue is total 2 excluding btc market cap
so my understanding is when the orange line crosses down underneath the blue line is when we get our mini alt season
as you can see from the dominance chart i posted earlier corn has a lot of room to go before its first resistance
so that basically is confluence for my btc pairs bleed untill btc ranges and money flows to btc pairs
that "mini Alt season" is basically people swapping their corn for lagging or too good to ignore coins
keep in mind they just need a few btc to move them 3-5X
anyways my plan is to secure profit IF the above plays out ( good time to do lever up on btc pairs )
then log off for a while ..
hope this helps someone still trying to figure out the lottle cycles within cycles

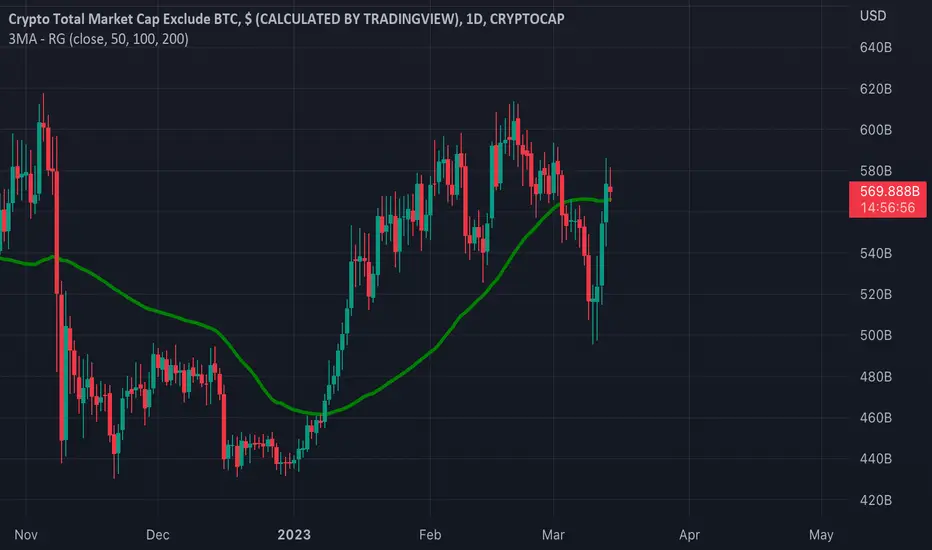
TOTAL2 - Strong Daily PositionStrong daily price point above the daily 50MA in green
It looks as if the bull is poking its head back out
This is a good sign for the bulls, more ahead from BTC and the crypto market as a whole.
Total 2 possible pathwaysHere are the possible scenarios for total 2 depending on how the macro structure and fud news will head in the near future…lets see how its gonna turn out,Always a student!

TOTAL2 Inverted H&SInverse H&S structure is forming on the altcoin market cap chart
This right shoulder might push the cap much higher and result in a recovery
Chart pattern analysis
Daily timeframe
📈 Altcoins On Sale (Buy Opportunity!) | The Law Of Three (3)Did you miss the January 2023 Cryptocurrency bullish wave?
Nobody blames you, it was an easy wave to miss after a very difficult year 2022.
It is normal to become a bit distant, detached, after such a bad year.
The great thing about financial markets is that there is always a second chance, new opportunities, more and more.
Here we have 3 weeks of red already and with each passing days, the prices become better and better in anticipation of the next bullish wave.
Do you think we will continue straight down, forever more?
No, no, no...
The market will recover, print another a new high, a higher high after cementing the current higher low.
The market is giving you an opportunity to load up on your favorite coins.
The Law Of Three (3)
✔️ If you bought and later secured profits.
✔️ If you missed the chance to buy in the previous wave.
✔️ If you just came in now and are thinking what will be.
Just remember to do your own research, build a plan and think long-term.
There is always risks involved but the market rewards those who wait.
Persistence and longevity is key.
Namaste.


ALTS attempting to break the 2 year Falling Wedge!The Crypto Total Market Cap excluding Bitcoin, has been trading within a Falling Wedge pattern for the past 2 years. Being kept from breaking above the 1W MA50 (blue trend-line) for three straight weeks, it appears that as the 1W MA200 (orange trend-line) continues to support, it will start to squeeze the price action and most likely will cause a break upwards as in May 2019. First target of the Falling Wedge break-out is the 0.5 Fibonacci retracement level at 860. Alts are heating up!
-------------------------------------------------------------------------------
** Please LIKE 👍, FOLLOW ✅, SHARE 🙌 and COMMENT ✍ if you enjoy this idea! Also share your ideas and charts in the comments section below! **
-------------------------------------------------------------------------------
💸💸💸💸💸💸
👇 👇 👇 👇 👇 👇
