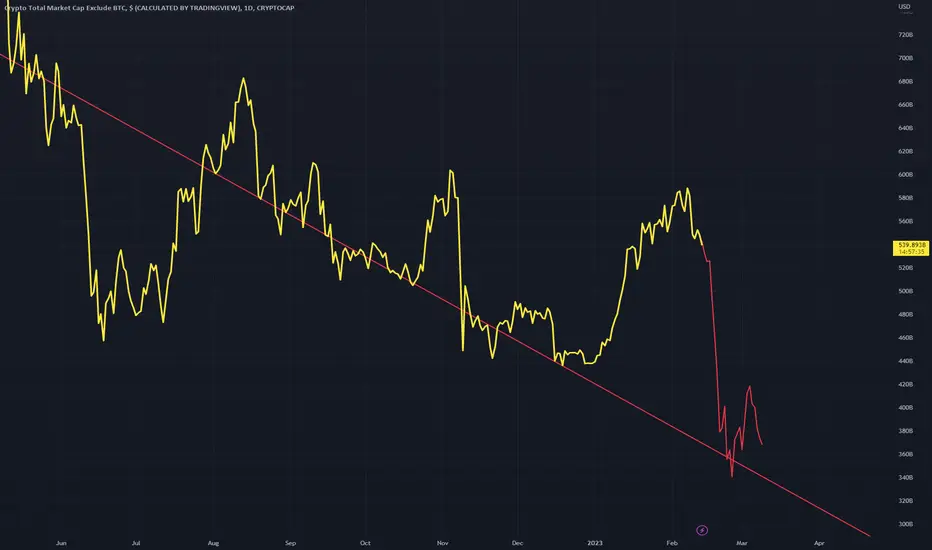
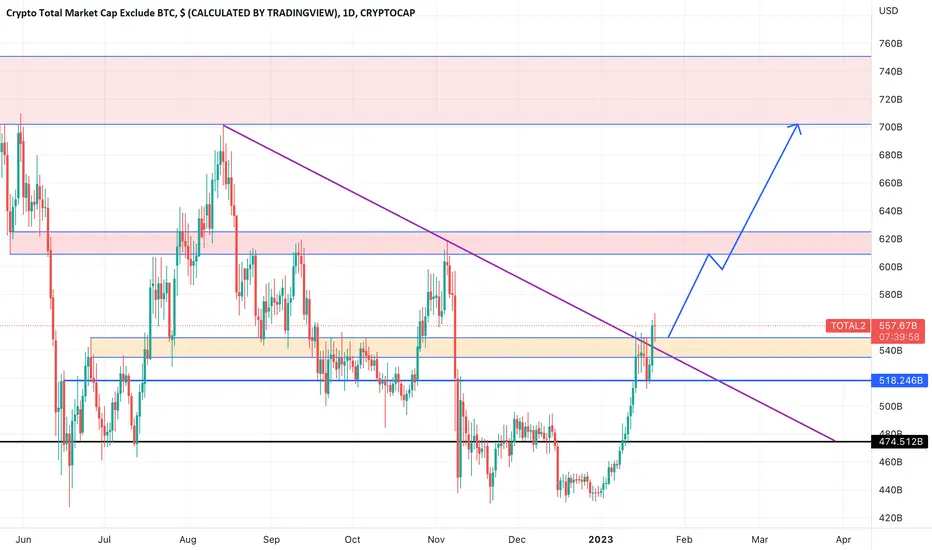
TOTAL2 Bear IdeaA bear idea showing two comparable points
A small rise followed by a larger down move back to the dominant bear downtrend
Lets see if the current bear trend is still dominant or if we have shifted to a bull standard
TOTAL2 trade ideas


3 DAYS EMA100/200I have already mentioned that EMA100/200 cross
on a large timeframe is a more stubborn thing than the same MA 50/200.
It's been a very long time since I posted a TOTAL2.
We have 4 crosses in history on this t.f.
1. Golden received in March 2016. The cycle to the next cross lasted 1030 days.
2. Death cross received in January 2019, the cycle to the next cross lasted 554 days.
3. Another golden cross in July 2020. And almost 800 days to the next red point.
4. Death cross received in September 2022. It's just been 152 days.
I have to tell myself something about why all of a sudden
a new golden cross should be received during the spring?
I'll just open a beer for now.

TOTAL2 Scenarios, Bull and Bear TOTAL2 has formed a strong upward movement, this could be followed by further upward movement, favoring continuation or a downward move, favoring the chart pattern of an inverted H&S
TOTAL2 is the altcoin market, but largely follows BTC and TOTAL
Lets see what happens
4Hr chart

$TOTAL Right Angled Descending Broadening FormationThis is a work of art. Thomas Bulkowski talks about the right angled and descending broadening formations, and this also fits into my previous outline of the TOTAL2 charts progress inside of a wyckoff distribution schematic.
Typically these dont break out on the first attempting, but the retrace now gives us the argument of a partial decline inside of this pattern as well.
Above that its the top of the range which would be the sign of strength in the wyckoff schematic.
From there you'd expect high and tight consolidation and then an expansion away from the range
Ill be following each level to look for reactions or more confluence with this idea.
More than likely, given the type of structure we have been seeing across the market, id be confident in a retrace to at least the .618 IF we break the top of the range.
Deep retraces would lessen my confidence. Impulsive waves should hold the .382, but any lower than the .50 id be concerned.
Its supposed to be a sign of strength and that would give confidence to the whole idea.
The implications, should this chart continue to play out in this fashion, are very positive for the alt coin markets.

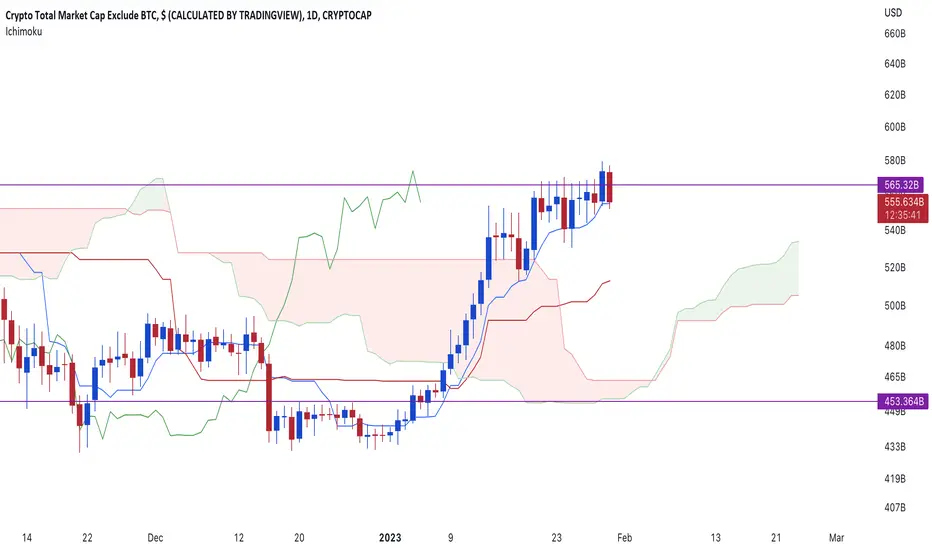
TOTAL2 8hr time frame looking goodWe should be reaching 680 billion shortly. That would be last August 2022 high. This is only a prediction, not a financial advise.

TOTAL2 looking good on weekly time frame A good case scenario can push TOTAL2 up to 1.2T by early April. Again this is only a prediction not a financial advise.

Ichimoku Analysis for TOTAL2weekly #IchimokuOTAL #alts chart suggest chop-chop as lagging is in the price. And with Kijun pointing downwards make sure to keep a good sl on your longs for now.
ALTseason on the way💰Alt season is in this year💥
But wich coin gainer of this altseason?😎
If you want dont miss next shib read comment👇
Amiri Cryptoe👊
( always profit _ never lose ) 😎

TOTAL2 - Bear TrendlineA bear trend line that could be touched one last time if mcap decides to break down further
This is similar to a scenario that occurred in the previous bear market
I do think we are seeing some more bullish results across the board however so this idea may become redundant if price climbs.
Total2 (Altcoins) is broken dynamic Supporthi everyone
as you can see total 2 is broken its dynamic support even pullback to broken support is confirmed and we will see more and more blood in most of the altcoins, if you check EHTBTC you will understand what i am saying...
just be careful and do not open any long position on altcoin, especially ETH.
please share your opinion in the comments
I consider all analyses performed in relation to that trade position.
Our analysis is not a buy or sell referral.
If you found our analysis useful and interesting, feel free to share it so that more individuals might benefit from it.
And please don't forget to like and comment; we will read them all.

TOTAL2 vs. DXY Corresponding Peaks & TroughsAs it does with Bitcoin and the stock markets, TOTAL2 crypto marketcap also shows corresponding peaks and troughs with DXY. When DXY makes a new peak, TOTAL2 sees a new trough shortly after, and when DXT makes a new trough, TOTAL2 sees a new peak shortly after.
Will TOTAL2 see a new peak form here after DXY'ss most recent low?
Or, has TOTAL2 not yet hit its corresponding trough from DXY's recent high?

Ichimoku Analysis for TOTAL2Are you afraid? well $TOTAL 2 looks like it is just fueling up. Finally breaks above the weekly kijun resistance here. Hope to get a good rally this week on the #alts. Any pullback of #Crypto towards tenkan san will be a good buying opportunity with kijun as sl.
Short term Crypto Total Market Cap AnalysisHi Everyone!
The TOTAL2 Index appears to have found a support area around 428 (see chart below), at least temporarily. Indeed, at the moment I cannot confirm of a bullish impulse structure (rally) formation, so I consider this last bullish leg as a technical rebound, at least until it destroys the resistance. It could be interesting to follow this index in the next sessions/weeks.
If this idea will be supported by your "Likes" we will continue to follow this analysis with updates below.
Thanks for your attention and please... trade with care! 💖

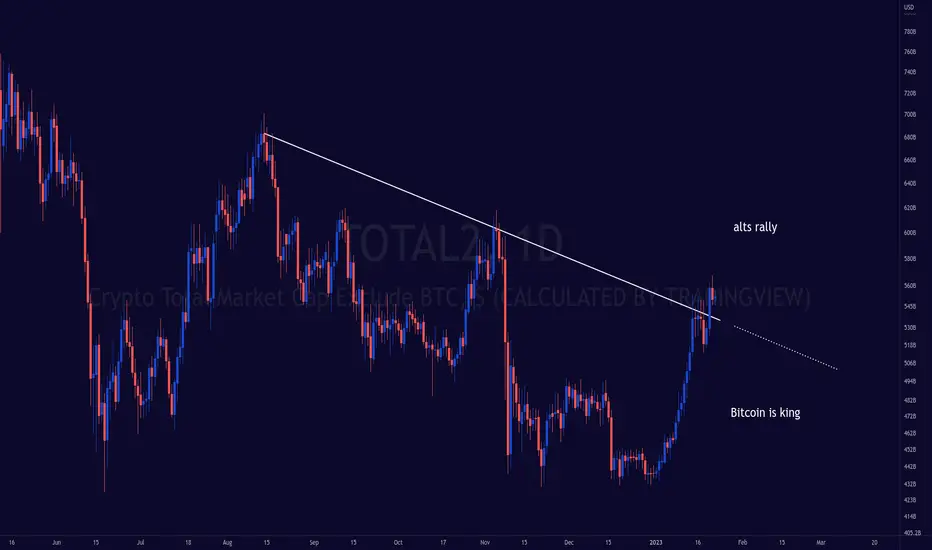
History Rhymes but doesn't RepeatComparing fractals between Total 2 and Bitcoin 2018
Significant market share has been taken by altcoins so comparing fractals is best to with TOTAL and not BTC vs BTC. Market symmetry leans towards 50/50 or 40/60 BTC to altcoins

TOTAL2 MA EvolutionThis is the 50,100 and 200MA
They are in their respective colors
I expect the 50 and 100MA to slowly curve around while the 200MA remains in a strong upward state
For those in long term
Weekly timeframe

#ALTCOIN MARKETCAP is Flashing Important Signal.Have a blessed Sunday to you all.
ALTMACP broke to the upside.
I am just skeptical about it for one reason, the confirmation candle closed in the red.
Unless we get a candle closing in green above the same, expect manipulation.
Be careful about holding the maximum portion of your portfolio in ALts.
Alt/BTC pairs will bleed.
I prefer holding BTC and a few alts with fundamental advantages like VRA is 230% already, HFT has started its run( Chart coming soon), and many other Gems APT did 4x.
So follow me if you want to know the next potential 50x coins!
DYOR, This is not financial advice.
Do show your support if you like my work.
Thank you
#PEACE

ALTCOIN MARKET CAP - TOTAL2Total Crypto Market Cap - Bitcoin Market Cap
As soon as Bitcoin stops pushing and consolidates I am expecting a good time for alts.
We Have SHIFTED to BULL TerritoryYesterday it looked like we wouldn't go through resistance but we did so now I'm a bull. Go with the flow be like water and win.

MARKET BULL SEASON ( ALTCOIN SEASON )Crypto coins started to be discovered. Everyone wants to be rich. And this is why it is turning to altcoins instead of btc.
Especially the Shit coin Doge, Hot, Btt, Chz, etc. It will turn to pump coins. Season is PUMP season.
If the first areas are happy, the last ones will suffer great losses.
Sorry, these are the Facts.
You can wait for years. It is useful to be careful.
Because when they get what they want, they have nothing left to buy from you.
Sorry, Doge will finish the season with Btc.
For now, I see it as May 31, 2021.
Stay tuned, ahead. I'll share the exact dates.
Enjoy it very much on May 31st.
Pay attention especially on May 24th.
Hill Hunt will go out (ALL TIME High will come).
Look at the top selling. May some others win.
Getting out in the right place is most important.
This season is the season of disposal.
Move up, those who open Short can do a lot of damage.
When the bear season comes, we will lower the prices together.
Pay Attention to Your Stops.

Total 2 breaking outHere in the chart is the possible pathway of Total 2, after breaking out of trend line. According to our previous analysis (in related ideas) regarding BTC dominance, the idea played out very nice and we got to the target. As I mentioned in that analysis after BTC.D hitting those regions we can expect a small Alt season possibly. So with Total 2 breaking out of trend line there is a descend possibility that it can play out.lets see how its gonna be.always a student!
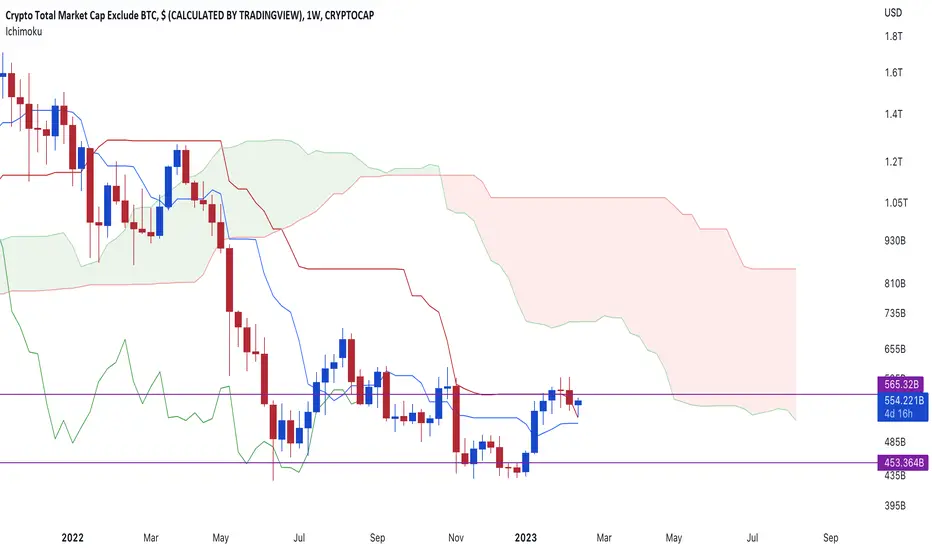
Altcoins limited upwards targets
Devastating targets down below remain active. Any rally should be used to exit spot / open shorts unless downtrend is flipped with confirmation.
Once 430B support gives way, its flush time
Hold my beer pls
----
No financial advice, do your own research, don't be stupid

ALTCOIN Market still consolidating. This shows its huge upside.The Altcoin market (total market capitalization excluding Bitcoin) is basically still consolidating. The long-term pattern is a Channel that is best described when using the Fibonacci Channel levels. Right now the price is on its bottom, with the 1W LMACD turning bullish since the August Bullish Cross.
The only times in the market's history this happened below the 0.00 mark designated the bottoms of December 2018 and May 2015. As you see on the chart, on all occasions (including today), the US10Y had already peaked and was on a downtrend. This suggests that the market has entered a strong Accumulation Phase, with long-term investors stacking ahead of the new Bull Cycle. This historically is the best time to enter the market.
-------------------------------------------------------------------------------
** Please LIKE 👍, FOLLOW ✅, SHARE 🙌 and COMMENT ✍ if you enjoy this idea! Also share your ideas and charts in the comments section below! **
-------------------------------------------------------------------------------
💸💸💸💸💸💸
👇 👇 👇 👇 👇 👇
