Total2 Altcoin Market Cap 8HIt is moving on a Bearish Rectangle and I'm expecting for a breakout to the downside soon. You can see support and resistance zones on the chart.
TOTAL2 trade ideas

Highly possible scenario Crypto bearish cycle end in 28/10/2022It is highly possible that we end the bearish cycle and market final bottom end of October 2022

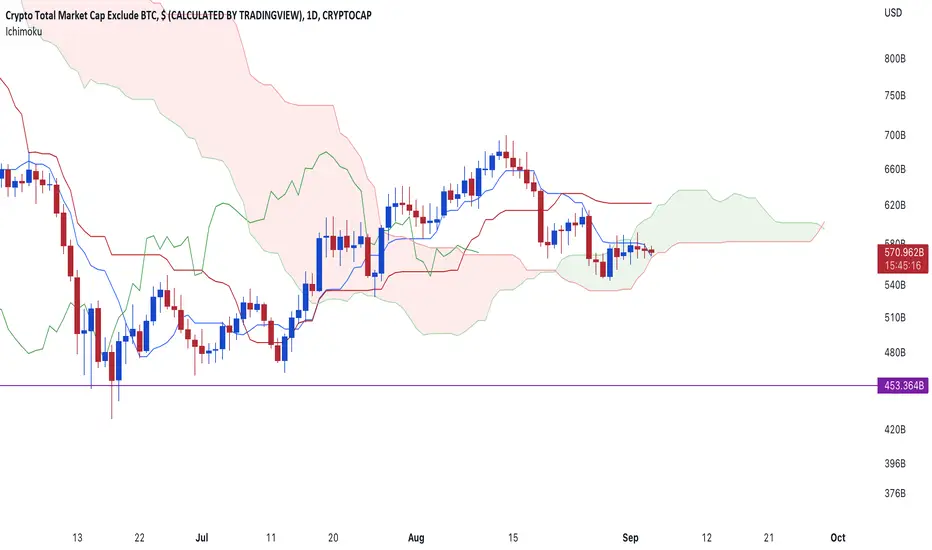
Ichimoku Analysis for TOTAL2With the bearish kumo crossover, now we just wait for it to come below the cloud for actual SALE to begin.
Total 2's ambiguous status is on the razor's edgeTotal 2's ambiguous status is on the razor's edge
Buyers and sellers are in a coma
If the resistance fails, the sellers will act aggressively and the named buyers will be desperate to leave

TOTAL 2 MarketCapThe main comment about crypto's marketcap is already published under the TOTAL analysis, but here we can see that VolumeTrend is reversing up and Momenter has signaled a reversal in Momentum.
Bullish for now.

TOTAL2 (Alts Marketcap) MUST EYE ON THIS!Are you familiar with TOTAL2 it is known as total market capitalization of the whole altcoins in the market.
As of the moment, we've spotted a cup and handle pattern on 4 hours time frame. The price action is having little pressure on this resistance area.
But I'm pretty sure if TOTAL2 breaks the current resistant, many of alt coins will fly eventually.
Trade responsibly guys!

Altcoins channel cross is still aheadUnlike Bitcoin the Altcoins channel cross is still ahead
A channel cross can signal the "bottom is in" since we saw lowest low in the red main bear run
A cross in 2022 is very likely IMO
What are your thoughts on that map dear Crypto Nation? 😎
*not financial advice
do your own research before investing


TOTAL2 Bottom FoundTOTAL2 Has formed a strong double bottom along the 4.618 fib line of a bear trend
This correlates well with a larger bear fib trend (green trendline)
I have plotted price action in bars pattern which shows a reversal out of this bear market
This is the altcoin market cap

[Watch it] Alts market may find a bounceFalling wedge, TD count 9.
Price moving through a descending channel.
Needs breakout of the falling wedge.
First target ideally 700b.
Idea invalidated on breakdown of descending channel.
Watch it.

One more leg down - swoop and then initiate Bull Possible top reached across markets - We get another
leg down, then we enter the mania phase which leads into
the Next Bull market. The chart has
confluence with others that
I will post
SOON.

🤖 #BTCLIVE - 15.08 - #IDEA 🤖 - Part 3🤖 #BTCLIVE - 15.08 - #IDEA 🤖 - Part 3
Hmmmmm....things are looking pretty bearish
Alt Market Cap
Currently in a bearish rising wedge, RSI is over stretched now and almost overbought and any further rise 75 and above will confirm a bearish divergence. Expecting a crash from here for Alts - money will flow out of alts and into primarily USDT and BETH* I feel the low caps are really going to feel the pain here. Additionally we are hitting the long term top of the descending channel as well as about to get smacked by the 200DEMA.
USDT Dominance
No surprise USDT Dominance is looking primed to breakout, there is a small chance capital can flow primarily into BTC although highly unlikely. Expecting USDT Dominance to pump. Currently in a long long term falling wedge - as money has been slowly buying positions in alts and BETH. We are additionally finding perfect support on the 200DEMA to bounce.
BTC Dominance
This is holding range well and at the lower end, expecting a large bounce here potentially to about 48% - given the other scenarios this makes perfect sense as capital will likely flow out of all crypto to USDT but out of BTC at a slower rate boosting the dominance quite fast.
BTC Price
Long term bullish but short term looking pretty bearish with the rising wedge, long term trendline resistance, 50DEMA resistance and the other scenarios painting a pretty bearish case.
*My new short-hand for BTC & ETH, don't sue me


CRYPTO - TOTAL MARKET CAP 2It's truly amazing how total market cap excluding btc runs in perfect channels.
So far we can see we are trnding up and first natural target is the main trend line which is aso the upper line of descending channel.
There I expect longer september correction which can lead us to the second touch of the lower band of our huge channel.
Making hgher low there would be imo very bullish for the nearest future.

Low Risk Crypto Shortsetup using Harmonic patternsKeep it simple. Using Harmonic patterns.
The chart speaks for itself, a beautiful AB=CD pattern with the D mark at 638.575B, the zone between that D mark and the 632.919B mark is a very Low Risk Crypto Shortsetup. You can also see the rejections of the price above the 632.919B mark in the past. If you put in scaled orders for going short in that zone you should be just fine.
𝘼 𝙡𝙞𝙠𝙚 𝙖𝙣𝙙 follow 𝙬𝙤𝙪𝙡𝙙 𝙗𝙚 𝙖𝙥𝙥𝙧𝙚𝙘𝙞𝙖𝙩𝙚𝙙!
Thank you and have a good one

TOTAL2 - Recovery FormationSimilar scenarios can be seen to the earlier green rectangle period
This green period was the result of a breakout from a falling wedge (recovery formation)
The green rectangle period we are approaching now also follows a recovery formation, however a different one, an inverted H&S
This rise will lead to another retest of the strong downward resistance in white
Daily timeframe


Alt SaisonAction reaction
Fibs
Presume this comes from btc partially (btc.d) but think smart money is poised also
GRI 2022

ALT M.CAP IS TRYING TO BREAK OUT!!Hello everyone, if you like the idea, do not forget to support with a like and follow.
Welcome to this TOTAL2 (Alt M.cap) update.
Total2 is forming a symmetrical triangle in the daily time frame. Currently, it is at the resistance trendline. Also, there is a 100MA. All we need is a close above the triangle and 100MA for a perfect breakout.
If it gives a perfect breakout then August will be very good for ALtcoins. We might see an 80-100% pump in many Alts. As of now waiting for a breakout.
Support:- $590B
If you like this idea then do support it with like and follow.
Also, share your views in the comment section.

TOTAL2 finally taps out the major resistance level around $605B - $640B. Index strength looking weak now and right now price testing the structural support around $590B. Market is bullish above $550B. If price unable to sustain above this then we gonna see some massive crash in the market.

BTC.D Testing Key support levelThis graph shows 1/Total Crypto Market Cap(excluding BTC).
Currently we are seeing general uncertainty in the most volatile market. It may be a better idea to hedge your positions with spreads . In other words, if you are bullish due to fundamental analysis factor on ETH or any other altcoin, you may place a long with your alt and a BTC short .
- Same goes for otherway around (BTC long, shitcoin short)
- This idea is based on the assumption that Cryptocurrencies move in the same direction

APEUSDT#APEUSDT Buy signaling 1D,2D Timeframe
The signal on this chart is typically very strong
>>>>>>>>>>>>>>>>>>>>>>>>>

TOTAL2 "No recession right now, but anything's possible"Such a slowdown, I.M.F. officials wrote, “will make it increasingly challenging to avoid a recession” — no matter how you define the term.
