Altcoins could see more pain as Feds keep up Interest rate hikesUsing a 4 hourly chart. Unfortunately, as we move into this bear market with all of the recession and inflation fears we will continue to see a drawdown in crypto prices. As I posted recently on a hidden bearish divergence with the Altcoin market cap chart we are starting to see a pullback already. I have a fractal for illustrative purposes only and as a visual of what can happen price-wise. Inflation numbers come out July 13th and then after this we will know how aggressive the Feds will be with the next rate hike.
TOTAL2 trade ideas

ALTS MARKET CAP UPDATE Hi guys, This is CryptoMojo, One of the most active trading view authors and fastest-growing communities.
Consider following me for the latest updates and Long /Short calls on almost every exchange.
I post short mid and long-term trade setups too.
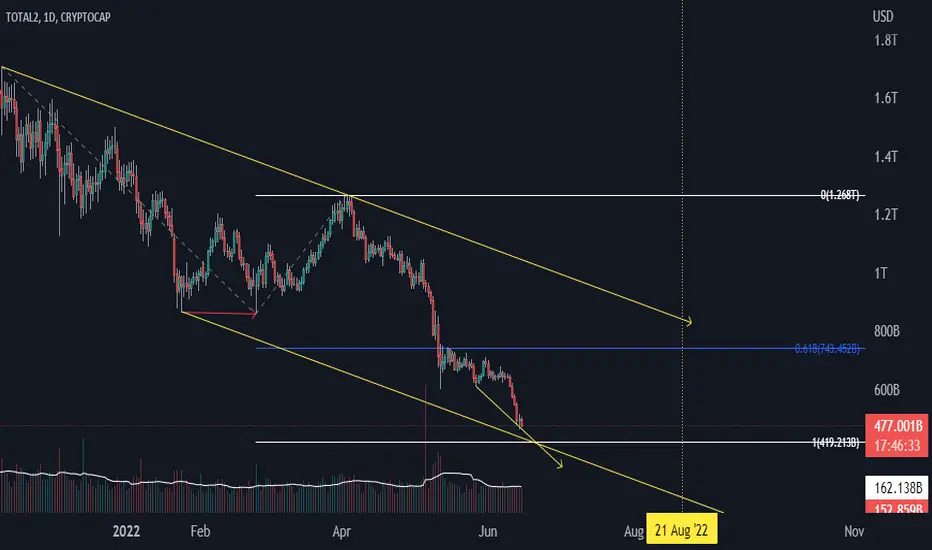
Let’s get to the chart!
I have tried my best to bring the best possible outcome to this chart, Do not consider it as financial advice.
ALTS MARKET CAP is making these two patterns in which one is bearish and one is bullish .
ALT MARKET CAP is forming bearish pennant in 4hr timeframe
If pannent broken downside then is ready for another 30% bearish wave.
TOTAL MARKET CPA is forming this symmetrical triangle also So let’s wait for a sustain break down or breakout will confirm the next move of the TOTAL MARKET CAP.
Let's see how the market will react in few hours.
Stay tuned
This chart is likely to help you make better trade decisions if it does consider upvoting it.
I would also love to know your charts and views in the comment section.
Thank you

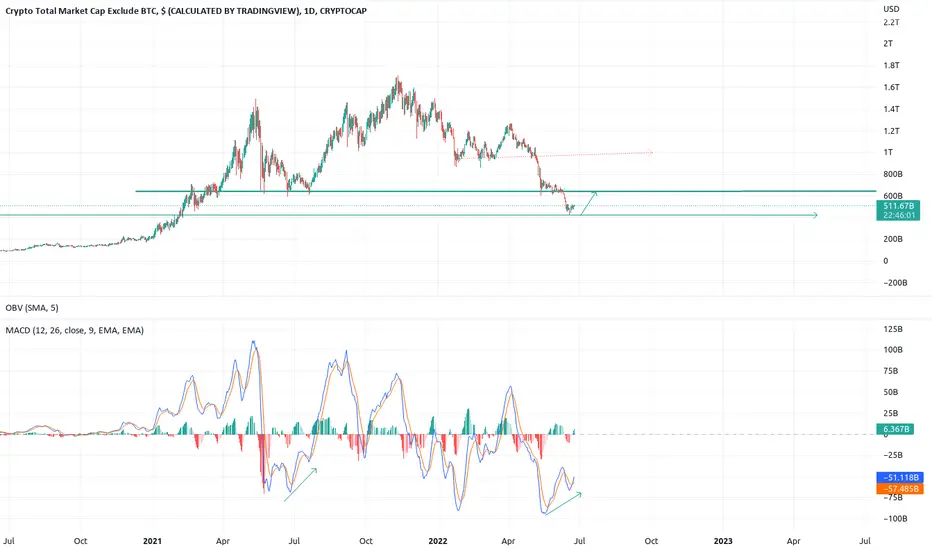
Next Bounce for Crypto?We've met resistance and recently seen some strong buying on this 5-year trendline. If it continues to act as support, then we might see a good bounce from here.

Altcoins Bearish Hidden DivergenceWe are posting a Hidden Bearish Divergence on the daily chart with Altcoin Market Cap.

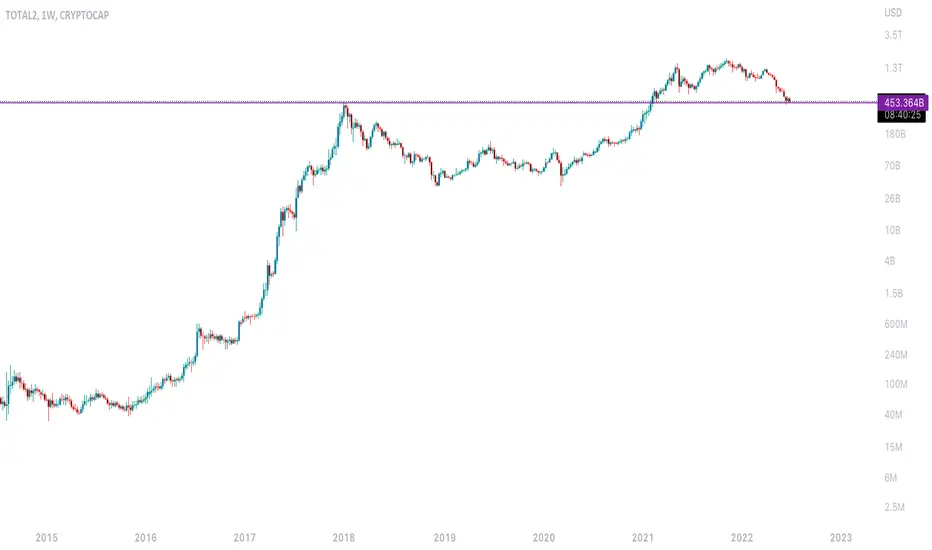
TOTAL2 Weekly TF Analysis (Bounce, Drop, Up)This is an interesting chart.
TOTAL2, the index for the top 125 cryptocurrencies excluding Bitcoin.
TOTAL2 bounced right at EMA300/MA200.
The grey/black lines on the chart.
TOTAL2 managed to close above EMA300 back in March 2020, afterward a strong bullish market followed.
This time around we can see another bounce at this level:
- The RSI is starting to curve upward.
- We can also appreciate a hidden bullish divergence.
The difference between now and March 2020 is big.
After March 2020 the market moved straight up.
After July 2022, we can see a bounce followed by another crash before the phase of sustained long-term growth.
(Bounce, drop then up)
TOTAL Weekly Chart:
Namaste.

Possible pathway for TOTAL2Here is my opinion on possible pathway and direction of TOTAL 2 in short term…Weakening of buying strength together with overbought state of channel with retrace back to channel indicates me of possible downward trend.
Lets see if it works out…
Always a student

TOTAL2 - New lows Soon - alts bleed 45%Higher low, higher low and again higher low. Clear Ultra bearish scenario. Alts about to bleed additional 35-45% where they will bottom and a mini alt season will start.
Buy in alts when this charts bottom and compare to BTC.D where it should be at 49% => HIGH BUY
TOTAL 2 following my strategy to the tick.
Thanks me later, cheers!

Total2 In a delicate position.Crypto market cap hanging by the edge. 50% more down from here if it fails to bounce.
TOTAL2 - Daily Bullish DivergencePrice prints lower lows
While indicator prints a higher low
This is a Classic Bullish Divergence
Daily timeframe
#ALT MCAP $500 billion at critical level.
ALT MCAP is moving towards the 100 MA support around $500 billion mcap.
This is an important level to hold.
A green close above this level could trigger a bullish rally across the market, until it happens we are short-term BEARISH.
Be careful.
Let me know what you think in the comment section. Do hit the like button if you like me to post these small updates.
Thank you
PEACE

TOTAL2 - Altcoin Market Bottom (200MA) TOTAL2 has endured most of its bearish activity, with price finally reaching the Weekly 200MA
This 200MA aligns perfectly with the prior 2017 bull run
An entry along this line is optimal

#TOTAL2 #ALTCOINS - forecast for the next 4 yearsI will be brief. The main article is in the appendix. In addition to it, I would like to offer a corresponding forecast for altcoin market capitalization.
On the graph I marked a supposed growth of capitalization. I do not give exact entry/exit numbers, but you can calculate the approximate ranges. The trend itself is important.
Not advice, but a demonstration of my own strategy for the next few years.
Good luck to all and strong seat belts in this rocket! 🚀

Altcoins bottom in october ? another 74% drop ? Well if you draw a trend line from the 2018 high to the bottom and copy it and put it on the 2021 high and will see a lot of confluence in the charts . if we drop by 91% just like previous bear markets you are likely to bottom on the trend line . Not only that you have a major green support zone that has been acting as previous resistance . Plus considering the inflation situation in the US . I think this summer we will see a very harsh fed . another 75 points are planned for july and probably for august . I think we will see inflation coming down only in september / ocotber that's when the markets will kinda see a small relief .

alt coinsalts will recover some loses, up till they hit ressiatnce, like i said you might want to start building position a couple days ago, massive divergences are being observed also CFTC will likely regulate the crypto space rather than the SEC thats also very bullish
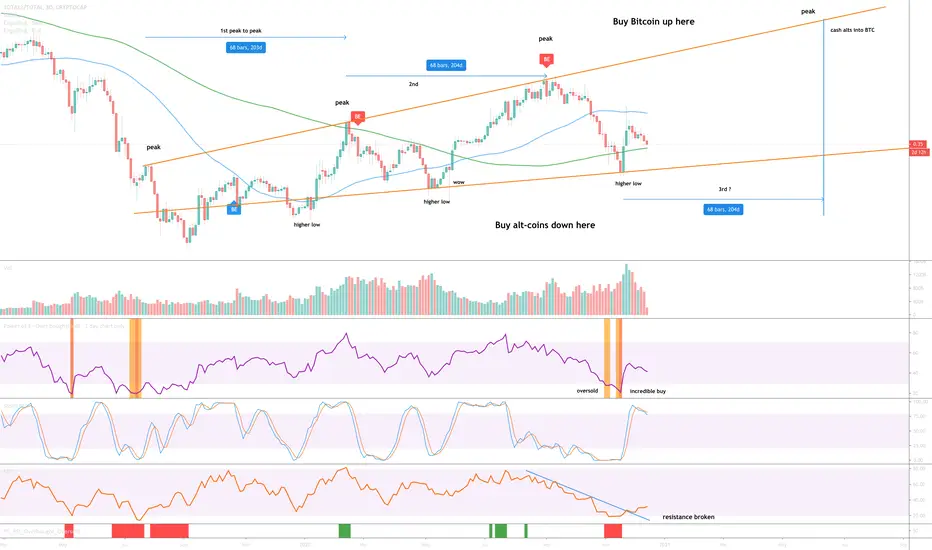
Alt-coin market is about to boomOver the months this 3-day chart has been very powerful for me. Think it is about time I shared it.
Over the last several weeks I’ve been selling my Bitcoin into various Alt-coin positions. It almost does not matter which, a rising tide lifts all boats to coin a phrase. My reasons for doing so is almost exclusively because of the this chart. Take time to study it.
This chart is showing you the ratio in dominance between Bitcoin and Alt-coins. So what’s going on?
1) Dominance between Bitcoin and alt-coins has been exchanging support and resistance in the above channel (between the orange lines).
2) Price action at the bottom of the channel is a superb time to get exposure to alt-coins.
3) Price action at the top of the channel was a superb time to sell those Alt-coins into BTC.
4) 204 days - peak to peak was 204 days in Alt-coin market tops. I don’t know why. The next peak in Alt-coins in Bitcoin terms is around Mid-June.
5) We can see Alt-coin dominance is about to test the 21-week moving average (green line), probably after Bitcoin makes another move up above $20k.
6) The ‘Oversold / incredible buy’ condition (orange column) on the above 3-day chart tells us we are at the bottom.
7) Money Flow Index (MFI - bottom oscillator) resistance was recently broken.
Questions? Just ask below ;)
alts marketcaplol finally touched the 200day ma on the weekly and immediately retraced, rsi is way oversold now, support after support have been crushed, . alot of top coins looking very good i think if one want to start builsing their long position at this level its very valid. make sure to choose the top coins with nice accumulation, and chose the ones that can sirvive on the long run,

TOTAL2TOTAL2
Like the Total chart, the situation is not good, and if the support of 460 is lost, we can have up to 230 drops, and if the support is provided, it is possible to increase the price up to the range of 600.
#TOTAL2 #TOTAL #BTC #BTCUSD #LUNA #LUNC #UST

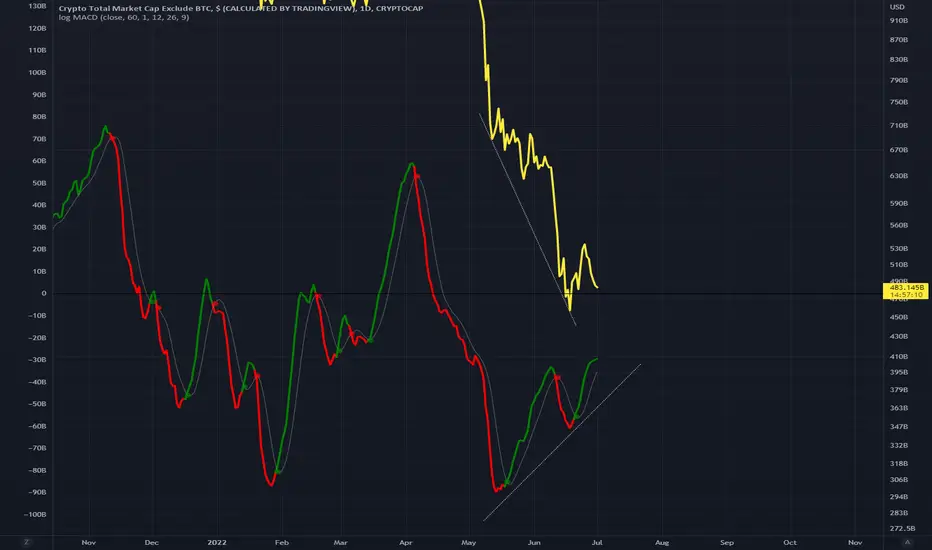
Crypto Market Cap UpdateInteresting things happening in this chart , Crypto Market Cap "Excluding BTC".
The head and shoulders pattern is clearly playing out and the technical target of this pattern would be at 303 billion dollars which happens to line up perfectly to the 0.618 Fib.
At the same time we have a very rare signal flashing in this RSI indicator I use , it's based on the elliott wave theory and shows when waves have completed 5 counts , since 2018 we have had just three signals and keep in mind this is not a lagging indicator its real time .
Last time we got green triangle was the bottom of the bear market in December 2018 and now its flashing again , keep in mind that in order to confirm this signal we must close the weekly and if market cap goes lower the signal will move to the next candle , always have to wait for candle after for confirmation of a trend reversal.
The point is that the fact that its flashed on means the bottom is could be near for the alt coins but this head and shoulders pattern has over 80% success rate so if it does play out it would be a brutal move down to 303 billion.

Total 2 - Wave count Daily Total 2 - Wave count Daily
this is the target for the end of the 4th wave from the weekly chart...
you will want to hold support here so that we can start the next impulse up we will call wave 5.
Total 2 - Wave countThis indicates a larger wave will come.
we label the next bull cycle wave as wave 5.
Using this logic , it means we are in the 4th wave.

Total2 Crypto - Monthly chart Total2 Crypto - Monthly chart
price is at support , where as TOTAL chart on the Monthly is not yet there.
this indicates that bitcoin is stronger then the general market including ETH. also check the TOTAL 3 chart.

total 2 weekly total 2 shows a return in daily time frame
it can revive Altcoins but there is a plan B for a greater crash in market after the date we reach to this price .

ALTCOINS TOTAL MC :UPDATEHELLO
total2 hitting the intersection of strong support lines... coinciding with #DXY reaching a strong resistance level,
All this indicates a temporary recovery of the alternative currencies during the next week.
